. 2017 Dec 11;8(1):2032.
doi: 10.1038/s41467-017-02289-3.

Estimation of immune cell content in tumour tissue using single-cell RNA-seq data

Affiliations

Estimation of immune cell content in tumour tissue using single-cell RNA-seq data

Max Schelker et al. Nat Commun. .

Abstract

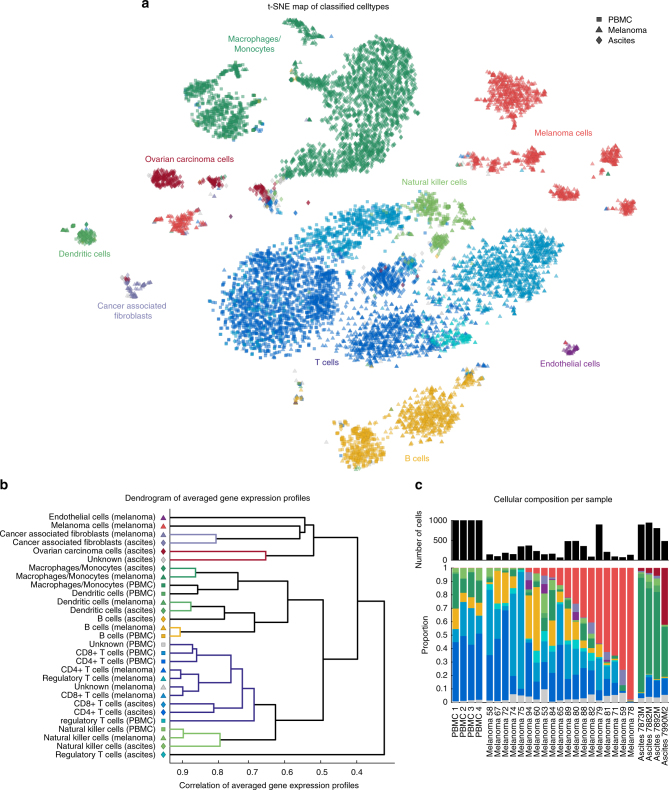
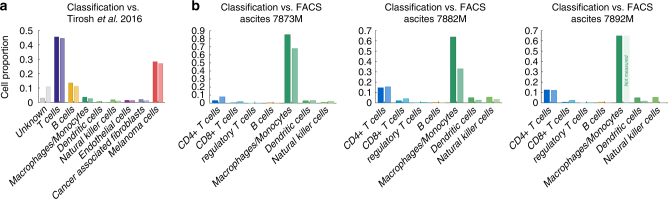
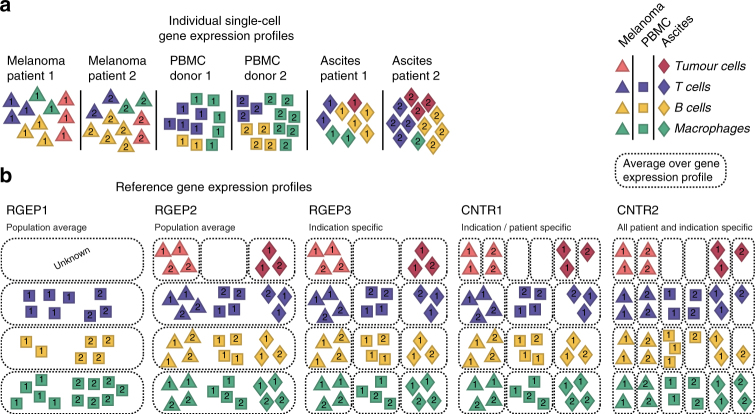
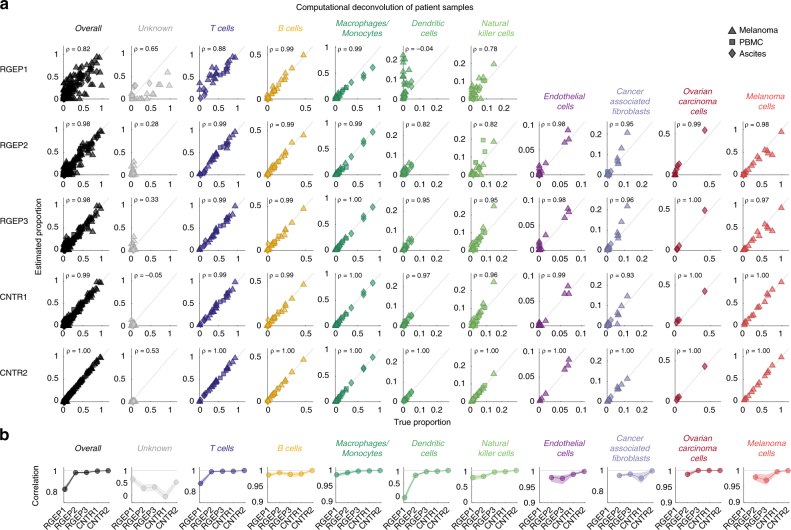
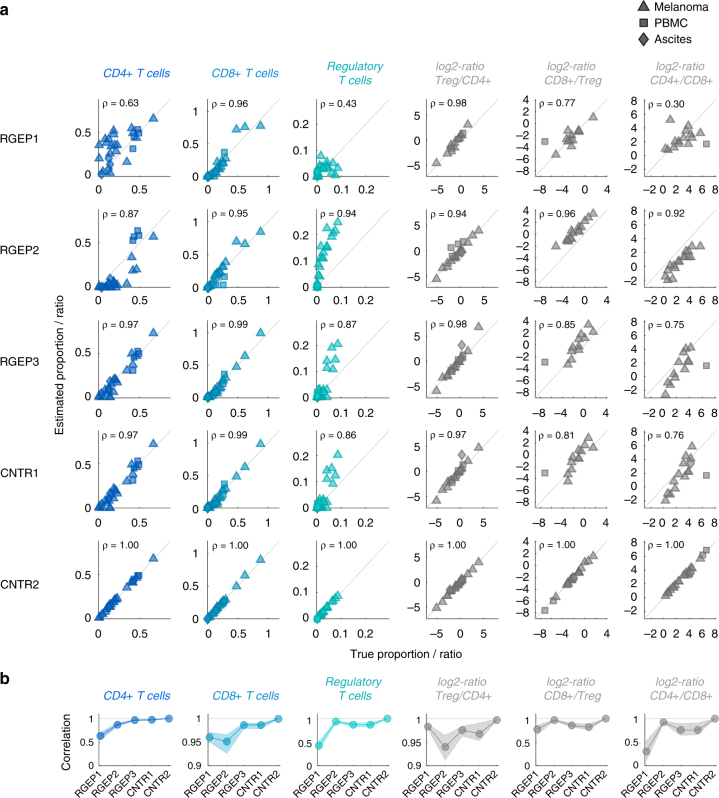
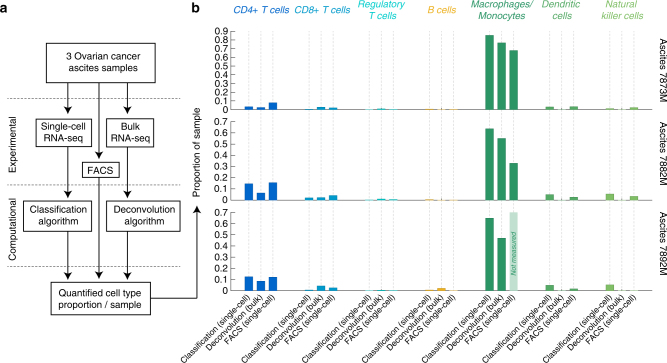
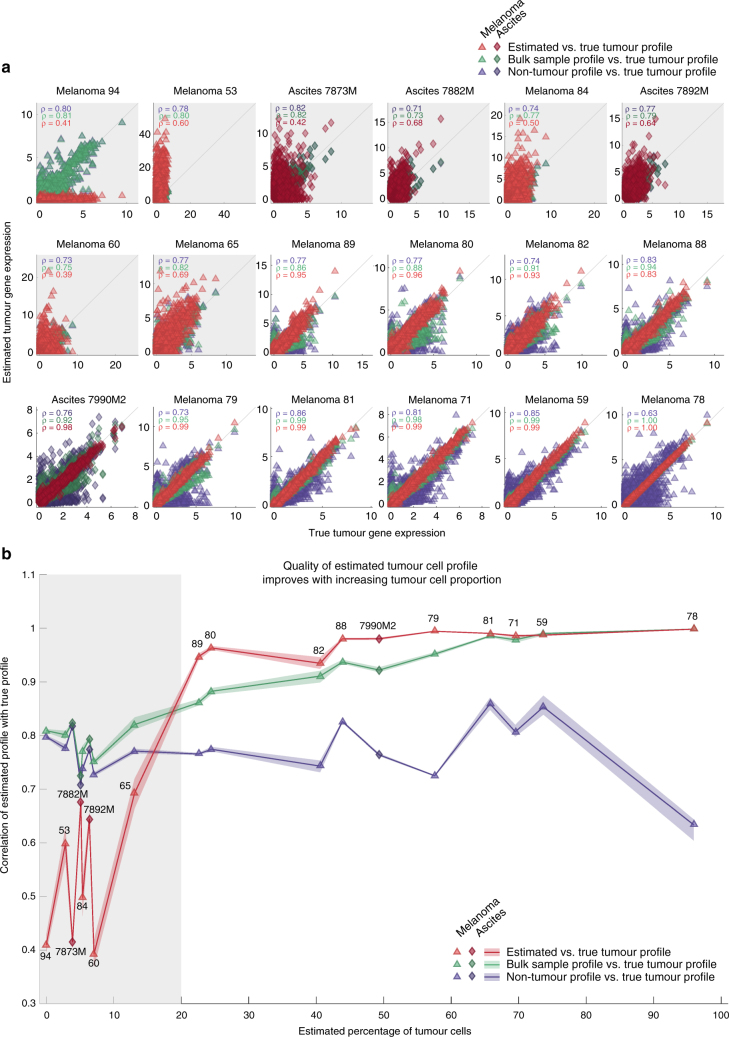
As interactions between the immune system and tumour cells are governed by a complex network of cell-cell interactions, knowing the specific immune cell composition of a solid tumour may be essential to predict a patient's response to immunotherapy. Here, we analyse in depth how to derive the cellular composition of a solid tumour from bulk gene expression data by mathematical deconvolution, using indication-specific and cell type-specific reference gene expression profiles (RGEPs) from tumour-derived single-cell RNA sequencing data. We demonstrate that tumour-derived RGEPs are essential for the successful deconvolution and that RGEPs from peripheral blood are insufficient. We distinguish nine major cell types, as well as three T cell subtypes. Using the tumour-derived RGEPs, we can estimate the content of many tumours associated immune and stromal cell types, their therapeutically relevant ratios, as well as an improved gene expression profile of the malignant cells.


Conflict of interest statement

The authors and Merrimack Pharmaceuticals, Inc. declare no competing financial interest.

Figures

Fig. 1
Fig. 1
Comparison of gene expression profiles of single cells from different data sources. a Single cells were arranged in two dimensions based on similarity of their gene expression profiles by the dimensionality reduction technique t-SNE. The clusters that emerge spontaneously can be associated with cell types (colours) and data source (symbol types: squares for PBMC-data sets, triangles for the melanoma-data sets, and diamonds for ascites data-sets). b Pair-wise correlation of averaged gene expression profiles of clusters encoding cell type and origin as identified in a visualised as dendrogram. c Number of cells and cellular composition per sample
Fig. 2
Fig. 2
Benchmarking the cell type classification to literature and experimental FACS analysis. a The result of our cell type classification (left bars, dark colours) compared to the cell types provided across all melanoma samples in the data-set by Tirosh et al. , (right bars, light colours). b Cell type classification (left bars, dark colours) compared to FACS data (right bars, light colours) for three ovarian ascites patient samples. For sample 7892M, macrophages/monocytes quantification is missing for FACS
Fig. 3
Fig. 3
Construction of five RGEPs for benchmarking the estimation accuracy. a For each source location (melanoma, ascites, PBMC) individual single cell gene expression profiles are collected for multiple patients. Colours indicate the cell type, numbers indicate the patient sample and symbols show the source location (triangles for melanoma, squares for PBMCs, and diamonds for ascites). b Construction of REGPs from three single cell data-sets: RGEP1 bases on the population average of PBMC data; RGEP2 takes all three source locations into account; RGEP3 is indication-specific and location-specific; CNTR1 is patient-specific for tumour cells and indication/location-specific for non-malignant cells; CNTR2 is fully patient-specific
Fig. 4
Fig. 4
Estimation accuracy of cellular composition is dependent on the origin and quality of RGEPs. a Scatter plot of true and estimated cell proportions for all 27 patient samples. Each dot represents one patient sample. Values close to the diagonal correspond to high deconvolution accuracy. Columns depict cell types; rows describe the five different configurations (REGP1-3 and CNTR1-2). ρ denotes the Pearson’s correlation coefficient. In configuration REGP1, estimates for tumour-associated cell types are not available. b Pearson’s correlation coefficient between estimated and true cell fraction for all five configurations. Dots denote the median of the correlation coefficient; the shading represents the uncertainty based on bootstrapping (upper and lower quartile). (Please note the different scaling of the figure axes.)
Fig. 5
Fig. 5
Estimation accuracy of T cell subsets within the T cell population and clinically relevant ratios of T cells and their dependence on the origin and quality of RGEPs. a Scatter plot of true and estimated cell proportions for all 27 patient samples. Each dot represents one patient sample. Values close to the diagonal correspond to high deconvolution accuracy. Columns depict cell types; rows describe the five different configurations (REGP1-3 and CNTR1-2). ρ denotes the Pearson’s correlation coefficient. In configuration REGP1, estimates for tumour-associated cell types are not available. b Pearson’s correlation coefficient between estimated and true cell fraction for all five configurations. Dots denote the median of the correlation coefficient; the shading represents the uncertainty based on bootstrapping (upper and lower quartile). (Please note the different scaling of the figure axes.)
Fig. 6
Fig. 6
Estimates of cellular composition by three different methods. Three ovarian cancer ascites samples were profiled by single-cell and bulk RNA sequencing, as well as FACS. a Process diagram of data and results generation for three ovarian cancer ascites samples. b Estimates of the cellular composition are derived by: (1) classification based on single-cell RNA sequencing data; (2) computational deconvolution on the bulk RNA sequencing data using the single-cell RNA sequencing derived RGEP3; (3) quantification by FACS. For sample 7892, macrophages/monocytes quantification could not be determined by FACS
Fig. 7
Fig. 7
Estimation accuracy of patient-specific tumour cell gene expression profiles. a Scatter plot of estimated vs. true transcriptome wide gene expression (17,933 genes) of the tumour cells for individual patient samples. Patient samples without any tumour cells have been excluded from this analysis. ρ denotes the Pearson’s correlation. Correlation plots with grey background indicate patient samples with less than 20% tumour cell content. Colours according to legend in panel b. b Correlation values from panel a plotted against the estimated proportion of tumour cells for each patient sample. Shading represents uncertainty based on bootstrapping. Symbols and numbering denote individual patient samples

References

    1. Drake CG, Lipson EJ, Brahmer JR. Breathing new life into immunotherapy: review of melanoma, lung and kidney cancer. Nat. Rev. Clin. Oncol. 2014;11:24–37. doi: 10.1038/nrclinonc.2013.208. - DOI - PMC - PubMed
    1. Intlekofer AM, Thompson CB. At the bench: preclinical rationale for CTLA-4 and PD-1 blockade as cancer immunotherapy. J. Leukoc. Biol. 2013;94:25–39. doi: 10.1189/jlb.1212621. - DOI - PMC - PubMed
    1. Schumacher TN, Kesmir C, van Buuren MM. Biomarkers in cancer immunotherapy. Cancer Cell. 2015;27:12–14. doi: 10.1016/j.ccell.2014.12.004. - DOI - PubMed
    1. Galon J, et al. Type, density, and location of immune cells within human colorectal tumors predict clinical outcome. Science. 2006;313:1960–1964. doi: 10.1126/science.1129139. - DOI - PubMed
    1. Ino Y, et al. Immune cell infiltration as an indicator of the immune microenvironment of pancreatic cancer. Br. J. Cancer. 2013;108:914–923. doi: 10.1038/bjc.2013.32. - DOI - PMC - PubMed

Publication types