. 2017 Dec 11;8(1):2049.
doi: 10.1038/s41467-017-02229-1.

The LPS-inducible lncRNA Mirt2 is a negative regulator of inflammation

Affiliations

The LPS-inducible lncRNA Mirt2 is a negative regulator of inflammation

Meng Du et al. Nat Commun. .

Abstract

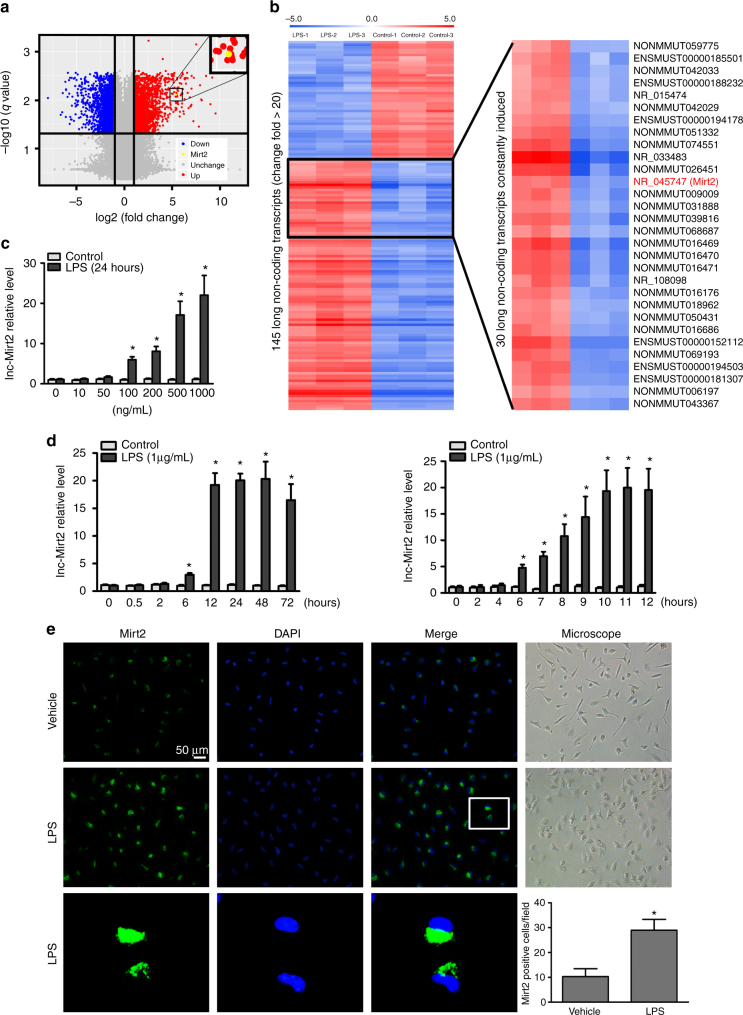
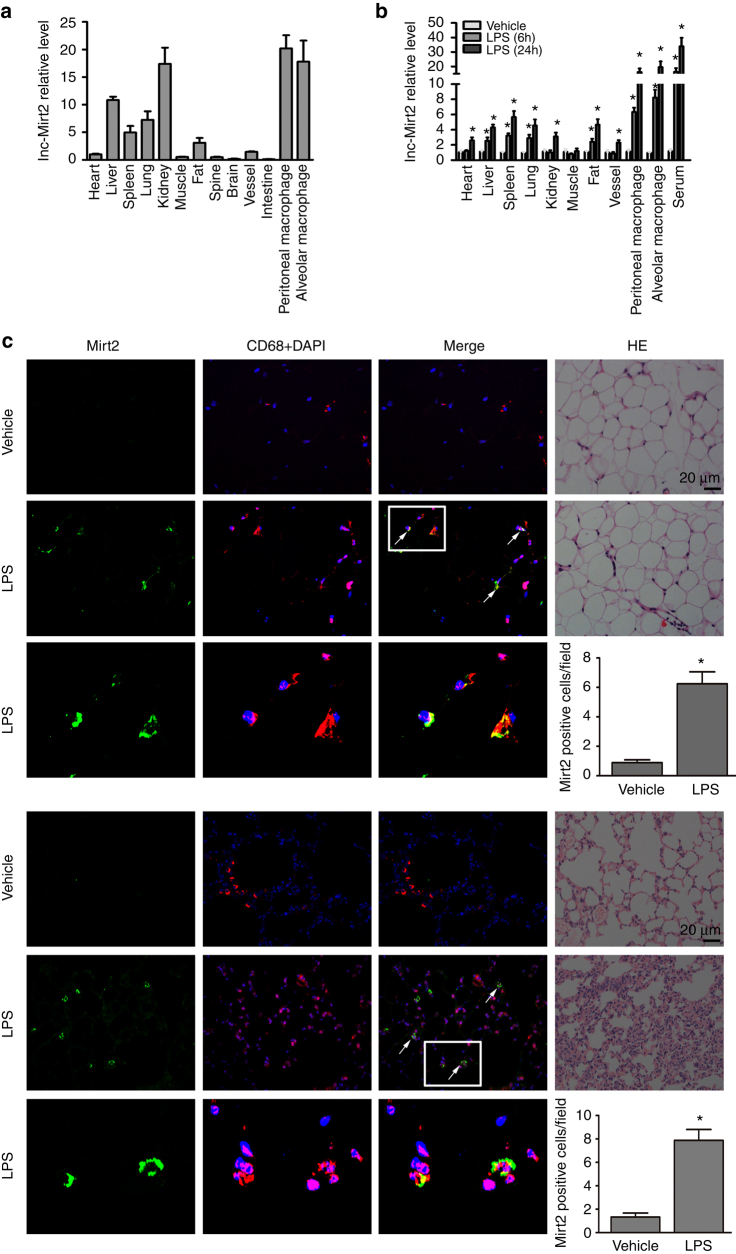
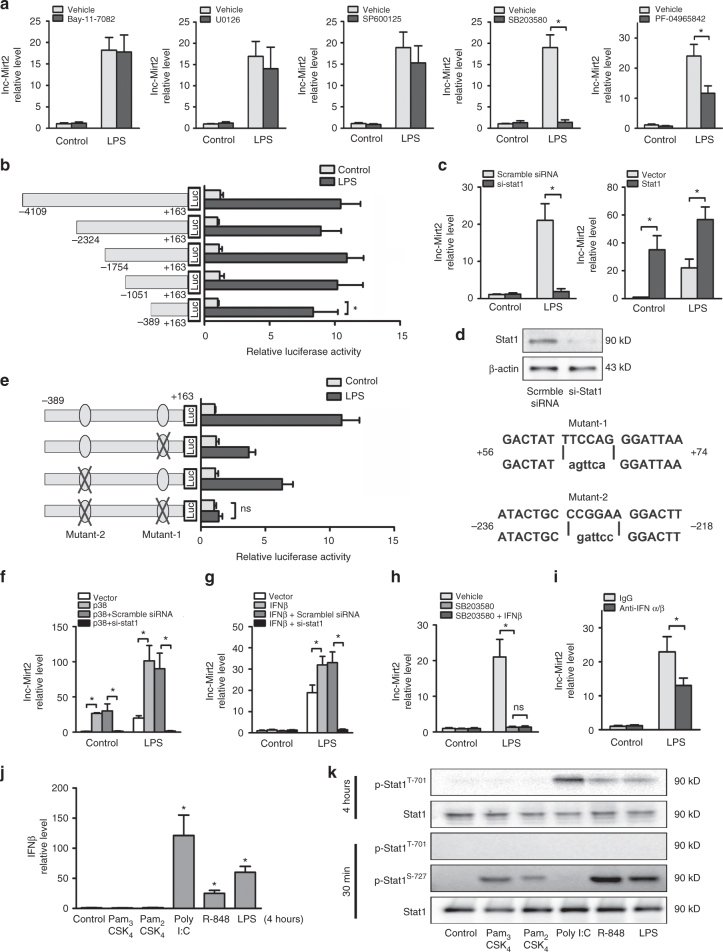
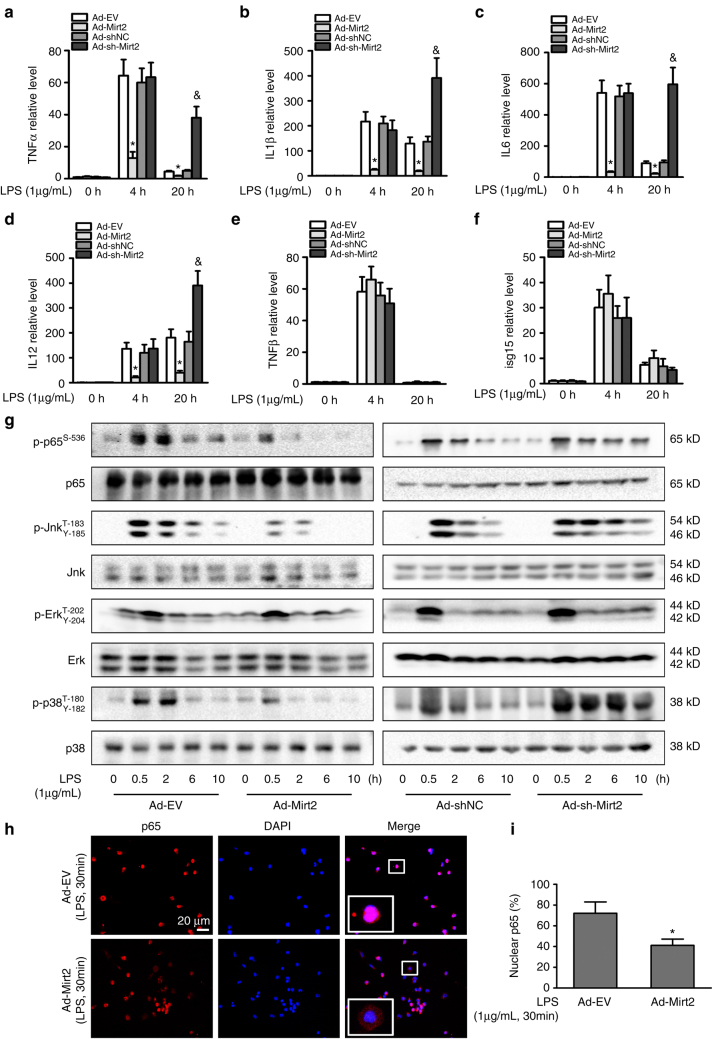
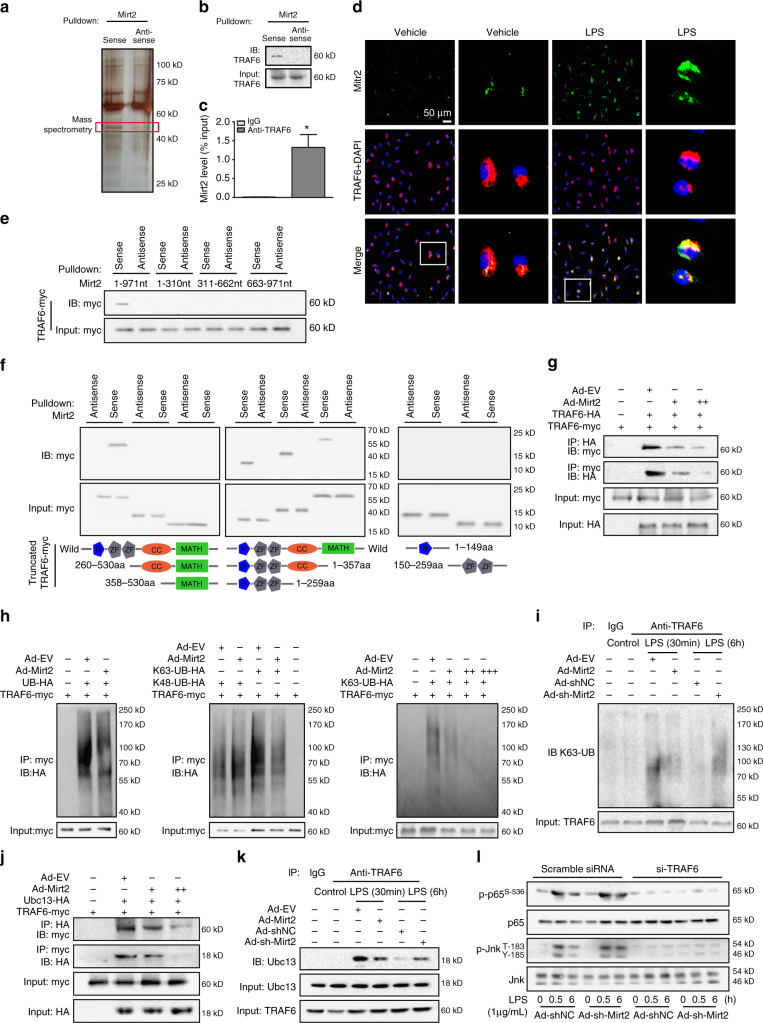
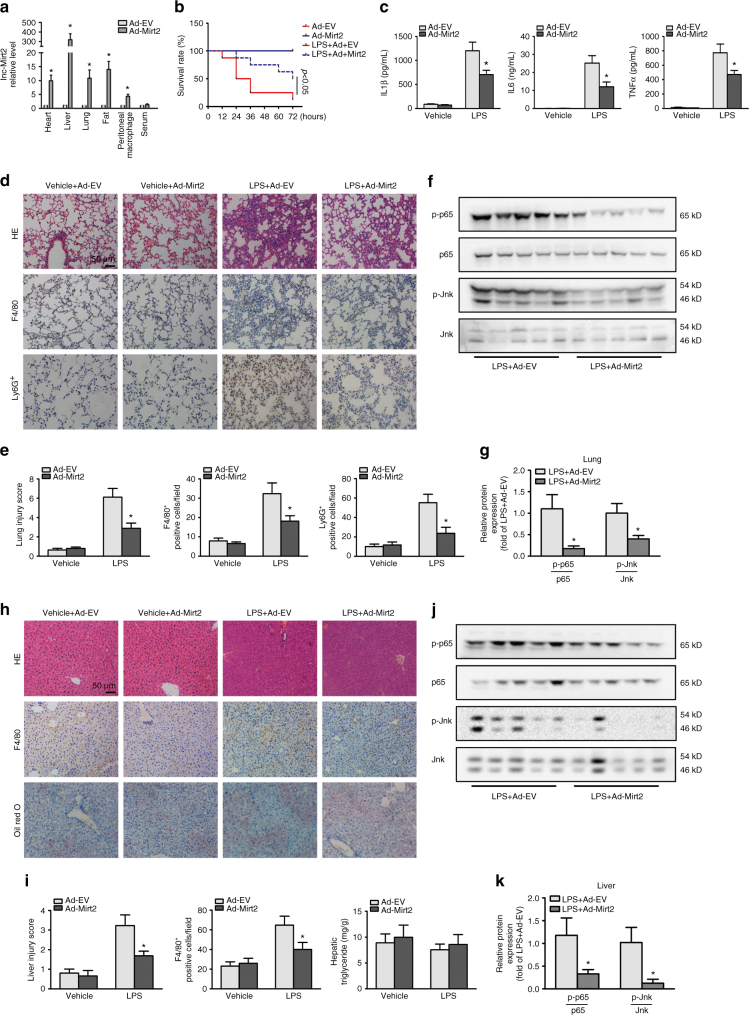
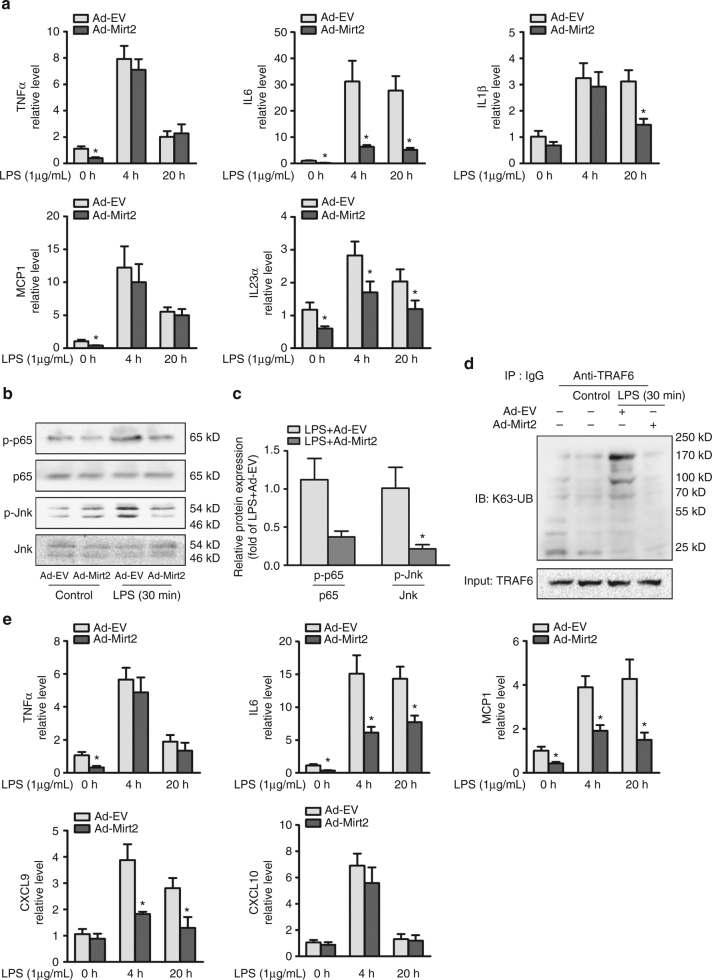
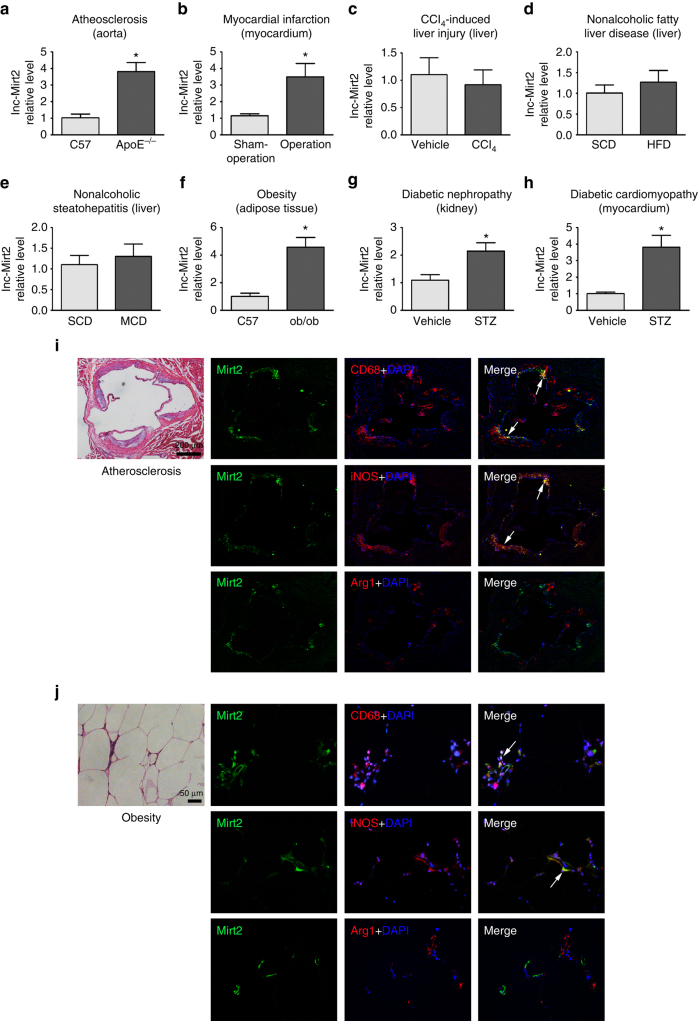
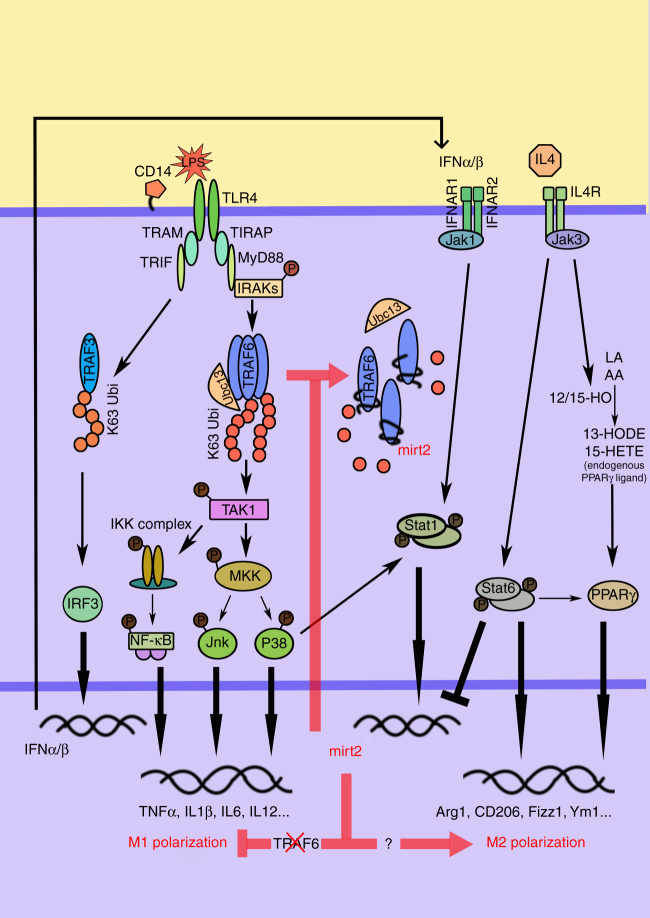
Toll-like receptors (TLRs) are a family of pattern recognition receptors (PRR) with a crucial function in innate immune responses. Activation of TLR4 signaling at the plasma membrane by lipopolysaccharide (LPS) stimulates proinflammatory signaling pathways dependent on the E3 ubiquitin ligase TRAF6. Here we show the LPS-induced long non-coding RNA (lncRNA) Mirt2 functions as a checkpoint to prevent aberrant activation of inflammation, and is a potential regulator of macrophage polarization. Mirt2 associates with, and attenuates Lys63 (K63)-linked ubiquitination of, TRAF6, thus inhibiting activation of NF-κB and MAPK pathways and limiting production of proinflammatory cytokines. Adenovirus mediated gene transfer of Mirt2 protects mice from endotoxemia induced fatality and multi-organ dysfunction. These findings identify lncRNA Mirt2 as a negative feedback regulator of excessive inflammation.


Conflict of interest statement

The authors declare no competing financial interests.

Figures

Fig. 1
Fig. 1
Differentially expressed lncRNAs in macrophages treated with LPS. a Primary cultured peritoneal macrophages were treated with LPS (1 μg/mL) for 24 h and then evaluated to determine their lncRNA profiles using an lncRNA expression microarray. A volcano plot showing the relationship between the q values and the magnitude of the differences in the expression values of the samples in the different groups. b The cluster heatmap shows lncRNAs with expression change fold > 20 from microarray data (P < 0.01). c The expression of Mirt2 in cultured peritoneal macrophages treated with LPS of concentration gradient for 24 h. d The expression of mirt2 in cultured peritoneal macrophages treated with LPS (1 μg/mL) for different times. e Macrophages, treated with LPS or vehicle, were labeled with a lncRNA-Mirt2 probe (green) using Fluorescent in site hybridization (FISH), and counterstained with 4′,6-diamidino-2-phenylindole (DAPI) (nucleus staining, blue). The number of positive cells in the field was quantified. Data represent the mean ± SEM of three independent experiments. *P < 0.05 vs. control group. Two-tailed Student’s t test for two groups
Fig. 2
Fig. 2
Mirt2 expression is induced in mice with endotoxemia. a Expression and distribution of Mirt2 in C57BL/6 mice. b Expression of Mirt2 in various tissues of endotoxemia mice challenged with LPS (25 mg/kg) for 6 and 24 h. c RNA FISH analysis of Mirt2 in adipose tissue (upper) and lung (lower) from normal or mice with endotoxemia. For colocalization analysis, sections were co-stained for Mirt2 (green) and CD68 (red, macrophage marker). DAPI was used for nucleus staining (blue). Arrows indicate Mirt2 and CD68 double positive cells. Double positive cells were counted in four sections per mouse and quantified. Data are expressed as mean ± SEM (n = 6). *P < 0.05 vs. control group Two-tailed Student’s t test for two groups
Fig. 3
Fig. 3
LPS upregulates Mirt2 in macrophages via p38-Stat1 and IFN-Stat1 signaling. a Cultured peritoneal macrophages were pretreated with selective pharmacological inhibitors Bay-11-7082 (NF-κB, 10 μM), U0126 (Erk, 50 μM), SP600125 (Jnk, 50 μM), SB203580 (p38, 50 μM) or PF-04965842 (Jak1, 50 nM), then cells were activated by LPS (1 μg/mL, 24 h). Expression of Mirt2 was detected by qRT-PCR. b Luciferase reporter constructs containing Mirt2 promoter or its truncations were co-transfected with an internal control plasmid pRL-TK into RAW264.7 cells, followed by LPS challenge (1 μg/mL, 24 h). The relative luciferase activities are expressed as a percent of values determined in control group. c Effects of Stat1 overexpression or Stat1 knockdown on the expression of Mirt2 in cultured peritoneal macrophages. d The knockdown efficiency for Stat1 siRNA. e Luciferase reporter constructs containing Mirt2 promoter (-389bp ~ +163 bp) or its mutants (for Stat1 binding sites) were co-transfected with an internal control plasmid pRL-TK into RAW264.7 cells, followed by LPS challenge (1 μg/mL, 24 h). The left panel demonstrates the relative luciferase activities, which are expressed as a percent of values determined in control group. The right panel demonstrates the mutation for two separate Stat1 binding sites. f Effects of p38 overexpression on the expression of Mirt2 in cultured peritoneal macrophages pretreated with scramble siRNA or si-Stat1. g Effects of IFN-β on the expression of Mirt2 in cultured peritoneal macrophages pretreated with scramble siRNA or si-Stat1. h Effects of exogenous IFN-β on Mirt2 expression inhibited by p38 inhibitor. i Cultured peritoneal macrophages were pretreated with antibodies against IFN-α/β, then cells were activated by LPS (1 μg/mL, 24 h). Expression of Mirt2 was detected by qRT-PCR. j The expression of IFN-β in cultured peritoneal macrophages treated with TLR ligands. k The phosphorylation of Stat1 induced by TLR ligands. Data represent the mean ± SEM of three independent experiments. *P < 0.05. ns none significant. Two-tailed Student’s t-test for two groups and one-way ANOVA for multiple groups
Fig. 4
Fig. 4
Mirt2 inhibits LPS-induced inflammatory responses in macrophages. af Effects of Mirt2 overexpression or Mirt2 knockdown on the expression of inflammatory factors induced by LPS in cultured peritoneal macrophages, as determined by qRT–PCR. Data represent the mean ± SEM of three independent experiments. *P < 0.05 vs. Ad-EV or Ad-shNC group. g Effects of Mirt2 overexpression or Mirt2 knockdown on the activation of NF-κB and MAPK pathways induced by LPS in cultured peritoneal macrophages, as determined by Western blot. h Effects of Mirt2 on p65 nuclear translocation in LPS-treated macrophages, assayed by immunofluorescent detection. i Quantification of p65 nuclear translocation in panel h. Data represent the mean ± SEM of three independent experiments. *P < 0.05 vs. Ad-EV. Two-tailed Student’s t-test for two groups and one-way ANOVA for multiple groups
Fig. 5
Fig. 5
Mirt2 inhibits TRAF6 oligomerization and auto-ubiquitination. a Silver-stained SDS-PAGE gel analysis of proteins in macrophages that are bound to biotinylated lncRNA-Mirt2. The highlighted regions were analyzed by mass spectrometry, identifying TRAF6 as a protein unique to Mirt2. b Immunoblotting analysis of proteins in macrophages bound to biotinylated Mirt2 using anti-TRAF6 antibody. c RNA immunoprecipitation (RIP) analysis to determine the recovery of Mirt2 in macrophages using anti-TRAF6 antibody. IgG served as control. Data represent the mean ± SEM of three independent experiments. *P < 0.05 vs. IgG group. d RNA FISH technology and immunofluorescent analysis to determine the co-localization of Mirt2 (green) and TRAF6 (red) in macrophages. DAPI was used for nucleus staining (blue). The images correspond to a single slice of Z-stacks and the experiments were repeated three times. e RNA pull-down analysis was employed to determine the interaction of TRAF6 with full-length or truncations of Mirt2. f Constructs for myc-tagged TRAF6 (wild type or domain truncation mutants) were transfected into HEK293T cells, pulled down by biotinylated Mirt2 transcript and examined by Western blot with antibody to myc. Bottom: the domain structure of TRAF6. g Immunoprecipitation of HA-TRAF6 (myc-TRAF6) followed by immunoblot analysis of myc-TRAF6 (HA-TRAF6) in HEK293T cells expressing both TRAF6 constructs to detect TRAF6 oligomerization in the presence or absence of Mirt2. h Immunoblot analysis of the ubiquitination of TRAF6 in HEK293T cells transfected to express myc-tagged TRAF6 and HA-tagged ubiquitin. Left panel: Total ubiquitination of TRAF6; Middle panel: K48-linked and K63-linked ubiquitination of TRAF6; Right panel: The effects of different concentrations of Mirt2 on the ubiquitination of TRAF6. i Immunoblot analysis of the K63-linked ubiquitination of endogenous TRAF6 in macrophages. j Immunoprecipitation of HA-Ubc13 (myc-TRAF6) followed by immunoblot analysis of myc-TRAF6 (HA-Ubc13) in HEK293T cells expressing both constructs to detect the interaction of TRAF6 and Ubc13. k Immunoblot analysis of the content of Ubc13 immunoprecipitated using TRAF6 antibody in macrophages. l Effects of Mirt2 knockdown on the phosphorylation of p65 and Jnk in macrophages transfected with si-TRAF6 or scramble siRNA, as determined by Western blot
Fig. 6
Fig. 6
Mirt2 attenuates LPS-induced endotoxemia. Endotoxemia was induced in C57BL/6 mice by intraperitoneal injection of LPS (25 mg/kg), and control animals were administered with equivalent volumes of normal saline. Adenovirus (Ad-Mirt2 or Ad-EV) were delivered into mice by tail veil injection 3 days before LPS challenge. a Adenovirus infection efficiency at 72 h after adenovirus administration. b Survival curve of mice with endotoxemia (n = 12). c Levels of cytokines (IL-1-β, IL-6 and TNF) in serum of mice challenged with LPS for 6 h. Data are expressed as mean ± SEM (n = 8). *P < 0.05 vs. Ad-EV group. d Histopathology in lung of Ad-EV or Ad-Mirt2 treated mice 24 h after LPS challenge. Upper panel: Hematoxylin and eosin staining; Middle panel: Immunohistochemical staining for macrophage marker F4/80; Lower panel: Immunohistochemical staining for neutrophil marker Ly6G. e Quantitative analysis of lung injury in panel d. Left panel: Lung injury score; Middle panel: Quantitative analysis of F4/80 positive cells; Right panel: Quantitative analysis of Ly6G positive cells. Data are expressed as mean ± SEM (n = 8). *P < 0.05 vs. Ad-EV group. f Western blot analysis for the phosphorylation of p65 and Jnk in lung of endotoxemia mice. g Quantification of band density in panel f. Data are expressed as mean ± SEM (n = 5). *P < 0.05 vs. Ad-EV group. h Histopathology in liver of Ad-EV or Ad-Mirt2 treated mice 24 h after LPS challenge. Upper panel: Hematoxylin and eosin staining; Middle panel: Immunohistochemical staining for macrophage marker F4/80; Lower panel: Oil Red O staining. i Quantitative analysis of liver injury in panel h. Left panel: Liver injury score; Middle panel: Quantitative analysis of F4/80 positive cells; Right panel: Determination of the contents of triglyceride. Data are expressed as mean ± SEM (n = 8). *P < 0.05 vs. Ad-EV group. j Western blot analysis for the phosphorylation of p65 and Jnk in liver of endotoxemia mice. k Quantification of band density in panel j. Data are expressed as mean ± SEM (n = 5). *P < 0.05 vs. Ad-EV group. Two-tailed Student’s t-test for two groups
Fig. 7
Fig. 7
Mirt2 has anti-inflammatory effects in tracheal epithelial cells and hepatocytes. a Effects of Mirt2 overexpression on the expression of inflammatory factors in tracheal epithelial cells, as determined by qRT–PCR. b Effects of Mirt2 overexpression on the phosphorylation of p65 and Jnk in tracheal epithelial cells, as determined by Western blot. c Quantification of band density in panel b. d Immunoblot analysis of the K63-linked ubiquitination of endogenous TRAF6 in Mirt2-overexpression tracheal epithelial cells treated with LPS, assessed after immunoprecipitation with TRAF6 antibody. e Effects of Mirt2 overexpression on the expression of inflammatory factors in hepatocytes, as determined by qRT–PCR. Data represent the mean ± SEM of three independent experiments. *P < 0.05 vs. Ad-EV group. Two-tailed Student’s t-test for two groups
Fig. 8
Fig. 8
Mirt2 in other inflammatory diseases. a Male C57BL/6J and ApoE–/– mice were fed a Western diet from 6 to 18 weeks old, then the mice were sacrificed and Mirt2 in aorta was detected. b Male C57BL/6J mice aged 8 weeks were suffered left-anterior descending coronary artery (LAD) ligation, and sham group as control. 24 h after operation, mice were sacrificed and Mirt2 in myocardium was detected. c Male C57BL/6J mice aged 12 weeks were injected intraperitoneally with a single dose of CCl4 (1 ml/kg) or an equal volume of vehicle. After 72 h, mice were sacrificed and Mirt2 in liver was detected. d Male C57BL/6J mice aged 6 weeks were fed with standard chow diet (SCD) or high fat diet (HFD) containing 60% calories as fat for 12 weeks. Then mice were sacrificed and Mirt2 in liver was detected. e Male C57BL/6J mice aged 10 weeks were fed with standard chow diet (SCD) or methionine-choline deficient diet (MCD) diet for 6 weeks. Then mice were sacrificed and Mirt2 in liver was detected. f Male C57BL/6J and ob/ob–/– mice were sacrificed at 24 weeks of age and Mirt2 in adipose tissue was detected. g, h Male C57BL/6J mice aged 10 weeks were injected intraperitoneally with 50 mg/kg/day STZ for five consecutive days. Age-matched control mice received an equal volume of vehicle. One week after STZ injection, fasting blood glucose was checked, and mice with blood glucose >300 mg/dL were used for experiments. The mice were sacrificed at 24 weeks of age and Mirt2 in kidney and myocardium was detected. i, j RNA FISH analysis of Mirt2 in atherosclerotic plaques from ApoE–/– mice i, and in adipose tissues from obese mice j. For colocalization analysis, sections were co-stained for Mirt2 (green) and CD68 (red, macrophage marker), iNOS (red, M1 marker) or Arg1 (red, M2 marker). DAPI was used for nucleus staining (blue). Arrows indicate Mirt2 and cell specific marker double positive cells. Data are expressed as mean ± SEM (n = 12). *P < 0.05. Two-tailed Student’s t-test for two groups
Fig. 9
Fig. 9
Schematic of the molecular mechanisms of Mirt2 in inflammatory responses. Activation of LPS-p38-Stat1 and LPS-IFN-α/β-Stat1 pathways transcriptionally promotes the expression of lncRNA Mirt2, and Mirt2 specifically inhibits the K63-ubiquitination of TRAF6, thus alleviating inflammatory responses after TLR4 activation and balancing macrophage polarization

References

    1. Medzhitov R, Horng T. Transcriptional control of the inflammatory response. Nat. Rev. Immunol. 2009;9:692–703. doi: 10.1038/nri2634. - DOI - PubMed
    1. Foster SL, Medzhitov R. Gene-specific control of the TLR-induced inflammatory response. Clin. Immunol. 2009;130:7–15. doi: 10.1016/j.clim.2008.08.015. - DOI - PMC - PubMed
    1. Murray PJ, Smale ST. Restraint of inflammatory signaling by interdependent strata of negative regulatory pathways. Nat. Immunol. 2012;13:916–924. doi: 10.1038/ni.2391. - DOI - PMC - PubMed
    1. Kawai T, Akira S. Toll-like receptor and RIG-I-like receptor signaling. Ann. N. Y. Acad. Sci. 2008;1143:1–20. doi: 10.1196/annals.1443.020. - DOI - PubMed
    1. Poltorak A, et al. Defective LPS signaling in C3H/HeJ and C57BL/10ScCr mice: mutations in Tlr4 gene. Science. 1998;282:2085–2088. doi: 10.1126/science.282.5396.2085. - DOI - PubMed

Publication types

Substances