. 2017 Dec 11;8(1):2036.
doi: 10.1038/s41467-017-02227-3.

Efficient dissolved organic carbon production and export in the oligotrophic ocean

Affiliations

Efficient dissolved organic carbon production and export in the oligotrophic ocean

Saeed Roshan et al. Nat Commun. .

Erratum in

Abstract

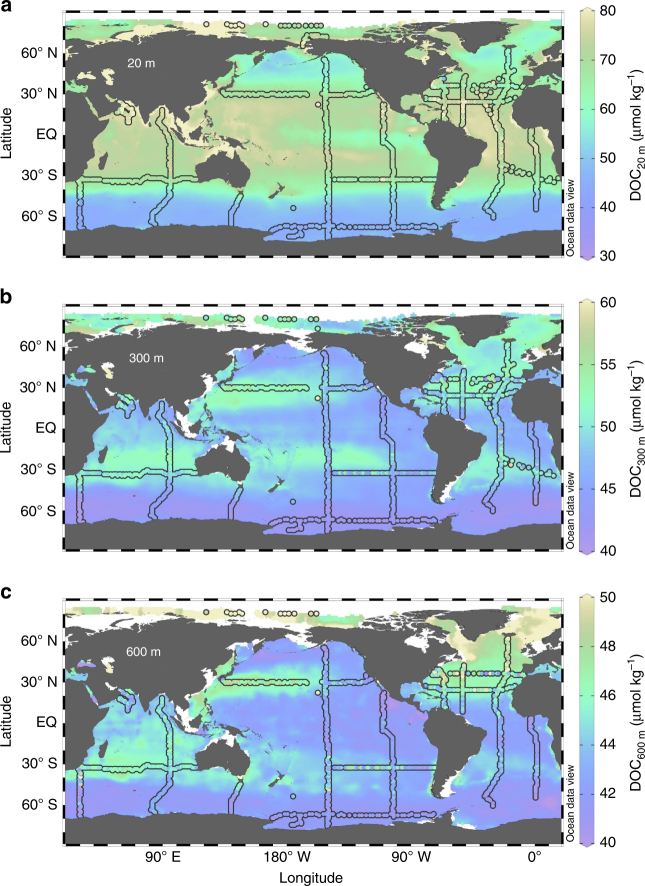
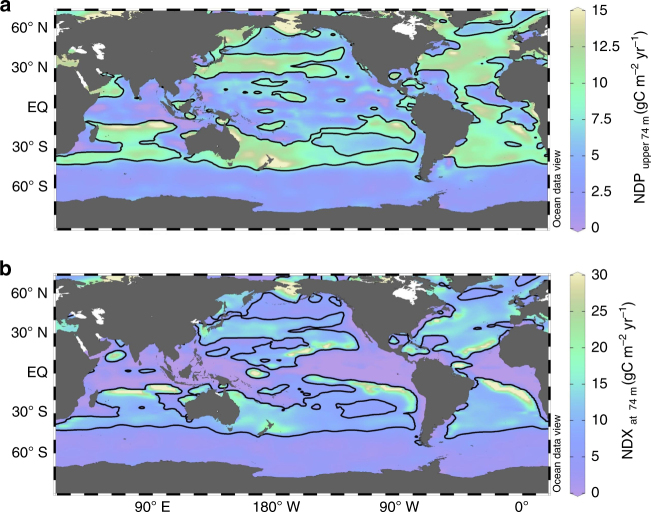
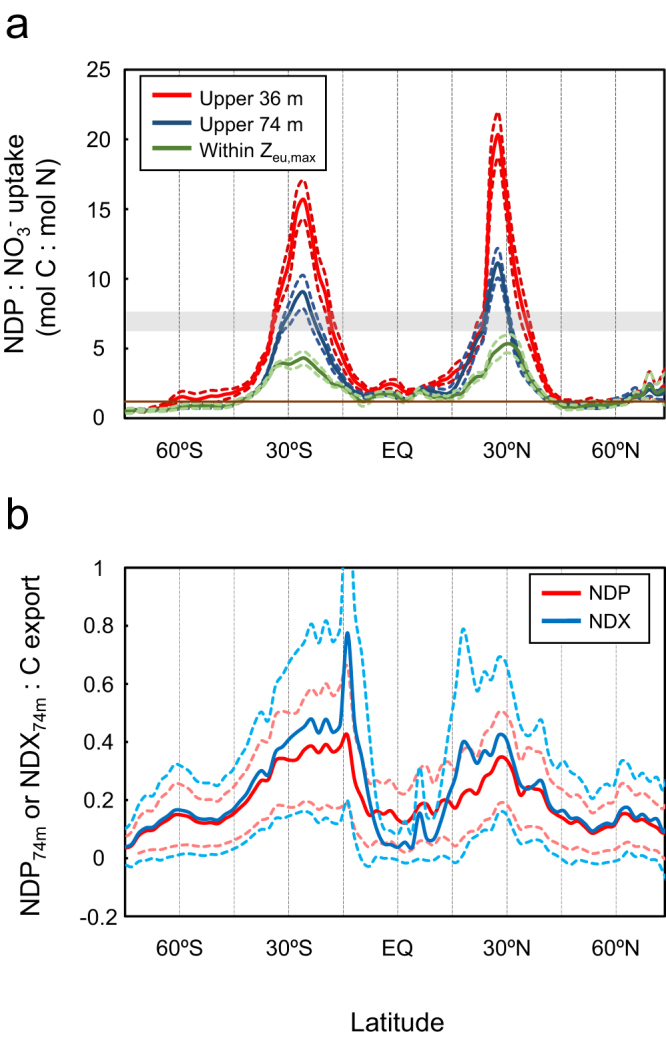
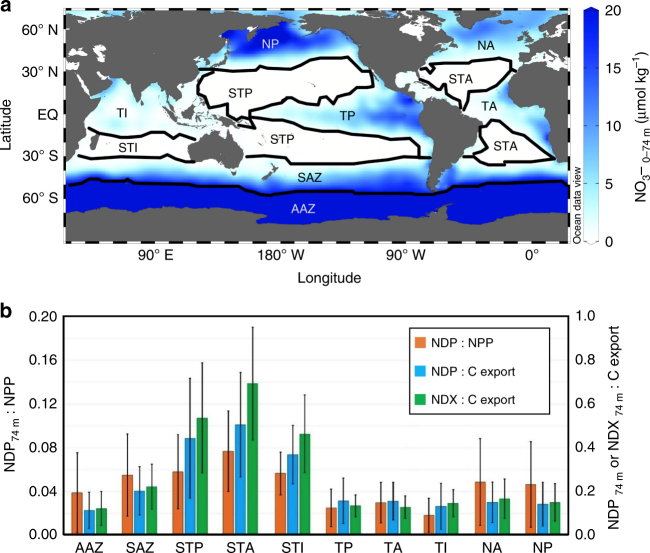
Biologically fixed carbon is transferred from the surface to deep ocean as sinking particles or dissolved organic carbon (DOC). DOC is estimated to account for ~20% of global export production, but the degree to which this varies regionally has not been assessed at a global scale. Here we present the first observationally based global-scale assessment of DOC production and export, obtained by combining an artificial neural network estimate of the global DOC distribution, and a data-constrained ocean circulation model. Our results demonstrate that the efficiency of DOC production and export varies more than threefold across oceanographic regions. DOC production and export display a pronounced peak in the oligotrophic subtropical oceans, where DOC accounts for roughly half of the total organic carbon export. These stratified nutrient-depleted regions are expected to expand with future warming, amplifying the role of DOC in the biological pump, and magnifying the need to improve DOC cycling in climate models.


Conflict of interest statement

The authors declare no competing financial interests.

Figures

Fig. 1
Fig. 1
Distribution of ANN-derived and observational DOC. Color map is the artificial neural network (ANN)-derived dissolved organic carbon (DOC) concentration, and colored dots are the observed DOC concentration at 20 m (a), 300 m (b), and 600 m (c). ANN-derived DOC correlates with ~30,000 observed DOC data points with slope = 1.00, R 2 = 0.95, and RMSE = 2.37 μmol kg−1. A correlation study of data points in the upper 74 m indicates slope = 1.00, R 2 = 0.85, and RMSE = 4.36 μmol kg−1
Fig. 2
Fig. 2
Maps of net DOC production and export fluxes. Net DOC production (NDP) in the upper 74 m (a) and net DOC export (NDX) below 74 m (b). At steady state, the global summation of NDX is equal to that of NDP, and is 2.31 ± 0.60 PgC yr−1
Fig. 3
Fig. 3
Latitudinal variability of DOC production and export to NO3 uptake and C export. a Zonally averaged ratios of net DOC production (NDP) to NO3 uptake within the upper 36 m (solid red line with dashed red lines indicating ±1 standard deviation), 74 m (solid blue line with dashed blue lines indicating ±1 standard deviation), and the deepest euphotic zone over the course of the year (Z eu,max; solid green line with dashed light green lines indicating ±1 standard deviation). Also shown is the global average ratio of C:N in POM (gray shading; ref. ) and the mean NDP:NO3 uptake ratio estimated in a previous study for the Atlantic Ocean (solid brown line; refs. ,). b Ratios of zonally averaged NDP (solid red line with dashed light red lines indicating ±1 standard deviation) and net DOC export (NDX; solid blue line with dashed light blue lines indicating ±1 standard deviation) to satellite-derived C export flux
Fig. 4
Fig. 4
Regional variability of DOC production and export to NPP and C export. a Distribution of depth-integrated mean of nitrate above 74 m, which is used to regionalize the global ocean into distinct regions (solid borderlines): Antarctic Zone (AAZ), Sub-Antarctic Zone (SAZ), Sub-Tropical Pacific (STP), Atlantic (STA), and Indian (STI), and Tropical Pacific (TP), Atlantic (TA), and Indian (TI), and North Pacific (NP) and Atlantic (NA). b Ratio of regionally averaged NDP and NDX fluxes to satellite-derived net primary productivity (NPP) and C export fluxes for the regions shown in panel a. Error bars in b indicate ±1 standard deviation
Fig. 5
Fig. 5
Regional relationship between DOC production:C export and several environmental parameters. Our diagnosed NDP:C export in the upper 74 m is plotted against regionally averaged temperature (a), F pico (fraction of picoplankton) (b) and log10(nitrate) (c). The diagnosed NDP:C export ratios can be explained using a multilinear regression (MLR) model with two predictor variables (F pico, and log10(nitrate)) (d). Error bars in ac indicate ±1 standard deviation. Dashed envelope in d is the 95% confidence interval of the MLR prediction

References

    1. Hansell, D. A., & Carlson, C. A. (eds). Biogeochemistry of Marine Dissolved Organic Matter (Academic Press, London, 2014).
    1. Hansell DA, Carlson CA, Repeta DJ, Schlitzer R. Dissolved organic matter in the ocean: a controversy stimulates new insights. Oceanography. 2009;22:202–211. doi: 10.5670/oceanog.2009.109. - DOI
    1. Carlson CA, Ducklow HW, Michaels AF. Annual flux of dissolved organic carbon from the euphotic zone in the northwestern Sargasso Sea. Nature. 1994;371:405–408. doi: 10.1038/371405a0. - DOI
    1. Emerson S. Annual net community production and the biological carbon flux in the ocean. Glob. Biogeochem. Cycles. 2014;28:14–28. doi: 10.1002/2013GB004680. - DOI
    1. Carlson CA, et al. Effect of nutrient amendments on bacterioplankton production, community structure, and DOC utilization in the northwestern Sargasso Sea. Aquat. Microb. Ecol. 2002;30:19–36. doi: 10.3354/ame030019. - DOI

Publication types

LinkOut - more resources