

doi: 10.1038/s41593-017-0031-y.
Epub 2017 Dec 11.
Regulation of developing myelin sheath elongation by oligodendrocyte calcium transients in vivo
Affiliations
- PMID: 29230052
- PMCID: PMC6478117
- DOI: 10.1038/s41593-017-0031-y
Item in Clipboard
Regulation of developing myelin sheath elongation by oligodendrocyte calcium transients in vivo
Nat Neurosci.
2018 Jan.
Abstract
How action potentials regulate myelination by oligodendrocytes is uncertain. We show that neuronal activity raises [Ca2+]i in developing oligodendrocytes in vivo and that myelin sheath elongation is promoted by a high frequency of [Ca2+]i transients and prevented by [Ca2+]i buffering. Sheath elongation occurs ~1 h after [Ca2+]i elevation. Sheath shortening is associated with a low frequency of [Ca2+]i transients but with longer duration [Ca2+]i bursts. Thus, [Ca2+]i controls myelin sheath development.
Figures
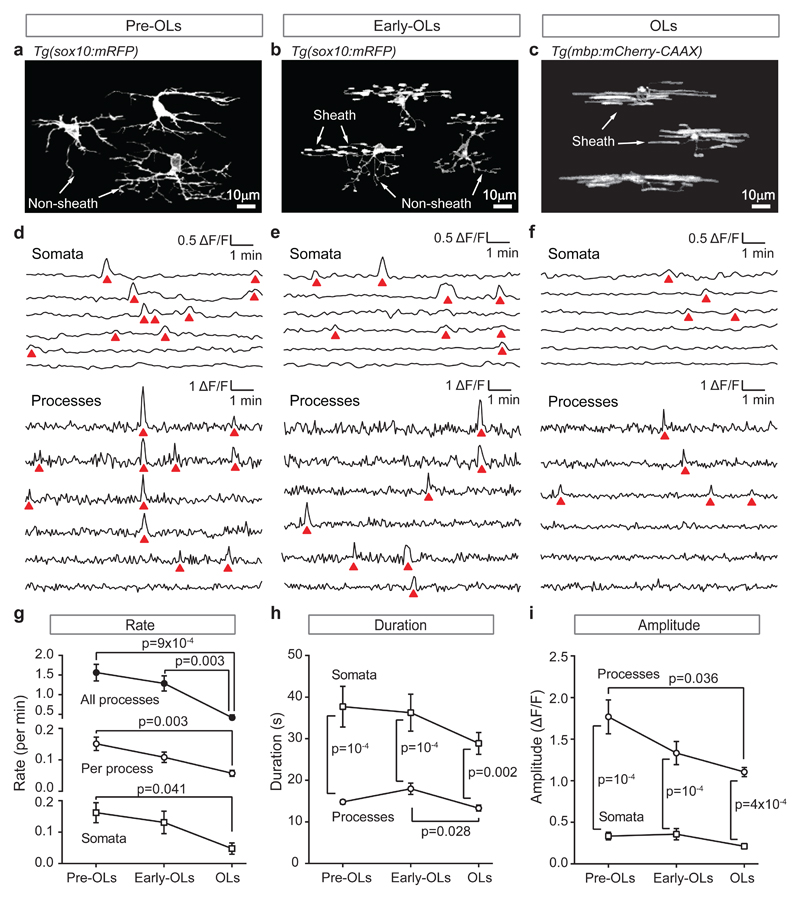
(a-c) Oligodendrocyte morphology at different developmental stages (3 cells from different CRISPR/Cas9-injected tg(sox10:mRFP) fish for each stage): (a) pre-OLs, before sheaths have been initiated; (b) early-OLs, when some sheaths have been initiated; (c) OLs, when all sheaths have been initiated. (d-f) Specimen [Ca2+]i traces for 3 developmental stages showing: (top) sequentially-recorded traces for the somata of 6 cells, and (bottom) simultaneously-recorded traces in different processes of a single cell of each class. A [Ca2+]i rise (red triangle) occurs simultaneously in 4 processes in d. (g-i) Rate, duration and amplitude of the transients at the 3 developmental stages (n=10 pre-OLs, 8 early-OLs and 8 OLs from 5, 6 and 6 animals respectively). P values are from 2-tailed tests: one-way ANOVA followed by Holm-Bonferroni-corrected t-tests in g for ‘all processes’, and h and i for ‘processes’; Kruskal-Wallis followed by Dunn’s test in g for ‘per process’ and ‘somata’, and in h and i for ‘somata’; two-way ANOVA followed by Holm-Sidak in h and i for ‘somata’ vs. ‘processes’. Data are mean±SEM.
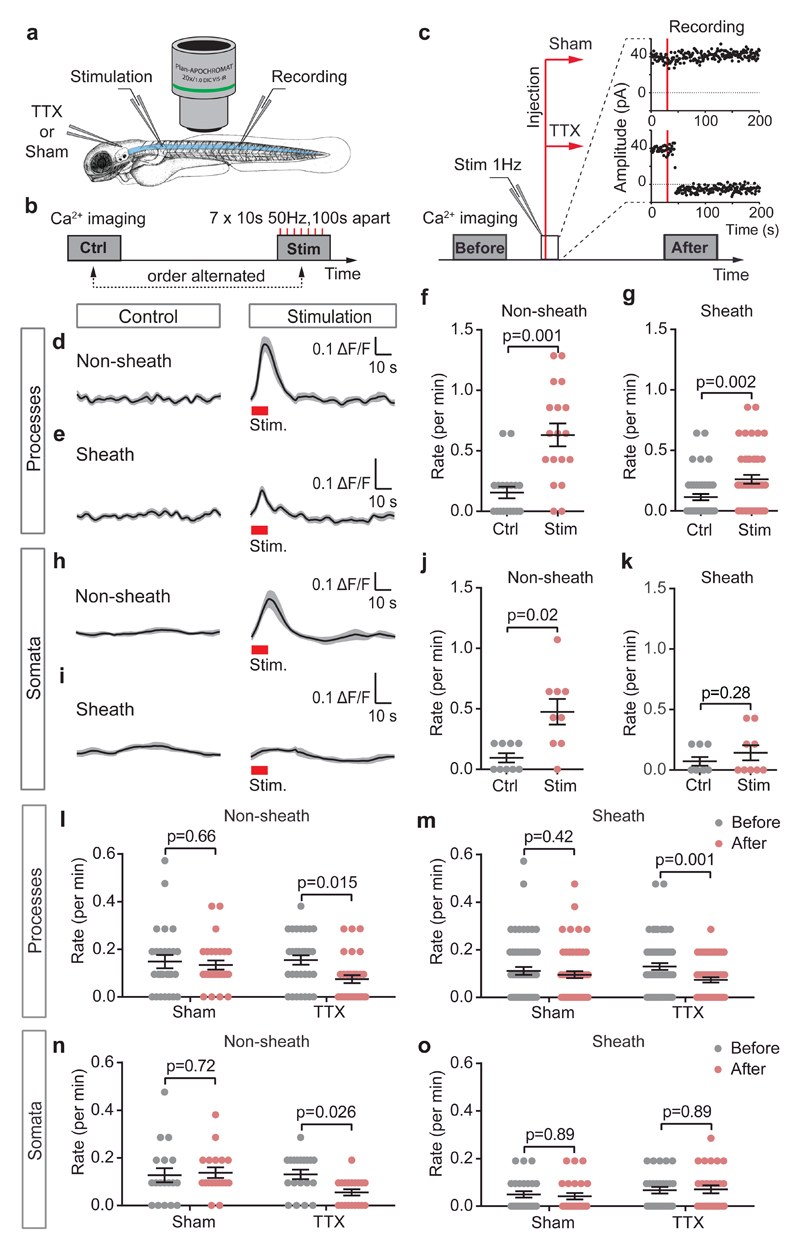
(a) Stimulating spinal cord rostral to the imaged area, and recording evoked activity caudally. In some experiments, TTX or Sham injections were into the hindbrain; 15 mins was allowed for diffusion to the imaged area. (b) Stimulation: 50 Hz pulses for 10 seconds, repeated 7 times every 100 seconds. (c) Field potential recording (at 1 Hz) before and after TTX (9 animals) or Sham solution (8 animals) injection showed abolition by TTX but not Sham. Calcium imaging was performed before and after the injection (red vertical lines). (d-e) [Ca2+]i traces (mean±SEM in grey) averaged over 7 periods without or with stimulation (red rectangles) in (d) 18 Non-sheath forming or (e) 45 Sheath forming processes. (f-g) Mean±SEM (points are individual processes) rate of [Ca2+]i transients without and with stimulation in (f) Non-sheath forming or (g) Sheath forming processes. (h-k) As for d-g but for somata (9 each for j and k). Experiments in d-k were from 5 animals. (l-m) Rate of [Ca2+]i transients before and after Sham or TTX injections in (l) Non-sheath forming (27 and 32 processes for Sham and TTX respectively) or (m) Sheath forming processes (59 and 61 processes for Sham and TTX). (n-o) As for l-m but for somata (18 and 19 somata for Sham and TTX in n; 25 and 27 somata for Sham and TTX in o). Number of animals for l-o was as in c. Statistical tests (2-tailed) used: Wilcoxon signed rank test in f, g, j; paired t-test in k; repeated measures ANOVA followed by Holm-Sidak for I, m-o. Data are mean±SEM.
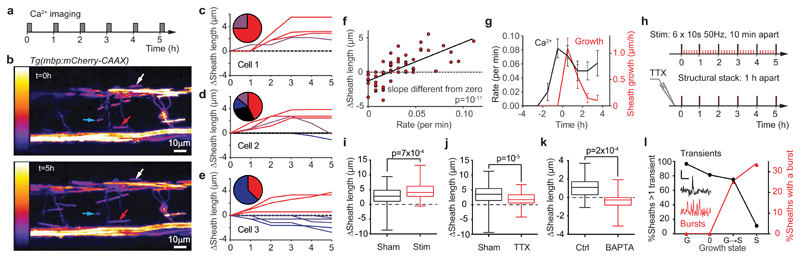
(a) Schematic of calcium imaging protocol. (b) Specimen images (5 hours apart) of tg(mbp: mCherry-CAAX) (hotter colours indicate more fluorescence, left scale) in developing oligodendrocytes. Red, blue and white arrows indicate sheaths that became longer, shorter or did not change length, respectively, over 5 hours. Experiments were repeated six times with similar results. (c-e) Sheath behaviour over time in 3 cells to illustrate diversity of behaviour. Pie charts show percentage of sheaths growing (red; 75% in c, 42.9% d, 37.5% e), growing then shortening (purple; 25% c, 14.3% d), shortening (blue; 14.3% d, 62.5% e), and not changing length (black; 28.6% d). (f) Change of sheath length over 5 hours as a function of mean [Ca2+]i transient rate (see Online Methods) in 68 sheaths. (g) Increase of sheath length per hour and [Ca2+]i transient rate in 14 sheaths which were of constant length for at least 1 hour before lengthening started (at t=0). Data are mean±SEM. (h) Protocols for experiments in i (top) and j (bottom). Large lines: structural stack acquisition; small red lines: stimulation. (i-j) Sheath growth over 5 hours in (i) 78 sheaths in 5 sham-stimulated fish and 71 sheaths in 5 stimulated fish, and (j) 99 sheaths in 6 sham-injected fish and 93 sheaths in 6 TTX-injected fish (box and whisker plots show median, 25th and 75th centiles, and most extreme data values). (k) Sheath growth over 3 hours for oligodendrocytes briefly whole-cell clamped with internal solution containing 1 mM EGTA (Ctrl, 24 sheaths from 6 fish) or 30 mM BAPTA (21 sheaths from 5 fish). (l) Percentage of sheaths with different growth behaviour (G, growth; 0, no change, G->S, growing then shortening, S, shortening) exhibiting >1 Ca2+ transients in the 63 mins imaged over 5 hours (black, left axis) or showing [Ca2+]i bursts (red, right axis). Insets show specimen transients and bursts (scale bars 1 min and ∆F/F=1). Different growth states are associated with significantly different numbers of transients (Chi-squared p=10-5, n=68 sheaths from 6 animals) and bursts (p=9x10⁻⁴). Because [Ca2+]i was only sampled for 10.5 mins per hour, and bursts are rare, it is possible that all (rather than 33% of) shortening sheaths experience [Ca2+]i bursts. Two-tailed statistical tests used: linear regression t-statistic in f; Mann-Whitney in i, j; unpaired t-test in k; Chi-squared test in l.
Comment in
-
Calcium control of myelin sheath growth.Nat Neurosci. 2018 Jan;21(1):2-3. doi: 10.1038/s41593-017-0043-7. Nat Neurosci. 2018. PMID: 29269759 No abstract available.
References
-
- Bengtsson SL, et al. Nat Neurosci. 2005;8:1148–1150. - PubMed
Publication types
MeSH terms
Substances
Grants and funding
LinkOut - more resources
Full Text Sources
Other Literature Sources
Miscellaneous
