. 2018 Jan;21(1):33-40.
doi: 10.1038/s41593-017-0037-5. Epub 2017 Dec 11.

Synaptotagmin-1 drives synchronous Ca2+-triggered fusion by C2B-domain-mediated synaptic-vesicle-membrane attachment

Affiliations

Synaptotagmin-1 drives synchronous Ca2+-triggered fusion by C2B-domain-mediated synaptic-vesicle-membrane attachment

Shuwen Chang et al. Nat Neurosci. 2018 Jan.

Abstract

The synaptic vesicle (SV) protein synaptotagmin-1 (Syt1) is the Ca2+ sensor for fast synchronous release. Biochemical and structural data suggest that Syt1 interacts with phospholipids and SNARE complex, but the manner in which these interactions translate into SV fusion remains poorly understood. Using flash-and-freeze electron microscopy, which triggers action potentials with light and coordinately arrests synaptic structures with rapid freezing, we found that synchronous-release-impairing mutations in the Syt1 C2B domain (K325, 327; R398, 399) also disrupt SV-active-zone plasma-membrane attachment. Single action potential induction rescued membrane attachment in these mutants within less than 10 ms through activation of the Syt1 Ca2+-binding site. The rapid SV membrane translocation temporarily correlates with resynchronization of release and paired pulse facilitation. On the basis of these findings, we redefine the role of Syt1 as part of the Ca2+-dependent vesicle translocation machinery and propose that Syt1 enables fast neurotransmitter release by means of its dynamic membrane attachment activities.


Conflict of interest statement

The authors declare no competing financial interests.

Figures

Fig. 1
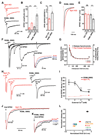
Fig. 1. Syt1 mediates dynamic membrane attachment via its C2B domain
(A) Schematic illustration of synaptic vesicle (SV), Synaptotagmin1 (Syt1) and plasma membrane. Ribbon diagrams of the Syt1 C2 B domain. Mutated residues are shown including Ca2+ binding site (D309, D363, D365) on the top, polybasic region (K324-K327; red) on the side, and R398, 399 at the bottom (blue) of the C2B domain. (B) Representative evoked autaptic excitatory postsynaptic current (EPSC) traces of hippocampal Syt1 WT, KO and KO neurons rescued with wild-type Syt1 FL (full length) and mutants. Depolarization artifacts and action potentials were blanked. (C) Averaged EPSC amplitudes. (D, E, F, G, H) Representative electron micrographs of synapses from Syt1 WT, KO and KO rescued with mutants before and 10 ms after single action potential (AP) stimulation. Scale bar: 100 nm (I) Averaged vesicle number within 5 nm of the AZ. Numbers were normalized to the active zone (AZ) lengths. (J) Averaged total number of SVs in the presynaptic terminal. Numbers were normalized to the synapse areas. (K) Experimental scheme for light stimulation protocol. A pulse of blue light (10 ms) is used to evoke APs, which is generated approximately 5 ms after light onset. A freezing point of 15 ms after light onset was selected as most of the events could be captured approximately 10 ms after AP. LN2: liquid nitrogen. (L) Averaged vesicle number within 5 nm to the AZ before and after AP. Data were normalized to AZ length and its resting condition. 3DA indicates mutations in the Ca2+ binding site of the C2B domain (D309, 363, 365A); 6DA indicates mutations in both Ca2+ binding sites of the C2A and C2B domains. (C2A: D178, 230, 232A; C2B: D309, 363, 365A). In (C), n represents the number cells analyzed. In (I, J, L), n represents the number of electron micrographs (synapses) analyzed. Data were obtained from cultured neuron from at least 3 independent cultures and shown as mean ± SEM. In (C, I, J), statistical significance was assessed by Kruskal-Wallis ANOVA test followed by Dunn’s multiple comparison test. In (L), Mann-Whitney test was used. ***p < 0.001; **p < 0.01; ns: not significant. For detailed numbers before normalization, the number of electron micrographs and statistical analysis see Supplementary Table 1A, B, C.
Fig. 2
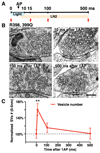
Fig. 2. Activity dependent Syt1 docking is transient and reversible
(A) Experimental scheme for light stimulation protocol. A pulse of blue light (10 ms) is used to evoke single AP. 10, 100, 500 ms time points are used to captured SV dynamics after AP. LN2: liquid nitrogen. (B) Representative electron micrographs of Syt1 KO rescued with R398, 399Q mutant before and 10, 100 and 500 ms after AP. Scale bar: 200 nm. (C) Normalized vesicle number (0-5 nm to the AZ) before (n = 126) and 10, 100, 500 ms after AP (n = 131, 125 and 127; respectively). Number of vesicles were normalized to AZ length and to the resting condition displayed as percentage. n represents the number of electron micrographs (synapses) analyzed. Data were obtained from neurons from 3 independent cultures and shown as mean ± SEM. Statistical significance was assessed by Mann-Whitney test. **p < 0.01. For detailed numbers before normalization, the number of electron micrographs and statistical analysis see Supplementary Table 1D.
Fig. 3
Fig. 3. Ca2+-induced Syt1 docking and release synchronization follow the same rate
(A) Representative single and paired-pulse EPSCs traces (10 ms apart) of autaptic neurons from Syt1 KO (red) and KO rescued with R398, 399Q mutant (black). Depolarization artifacts and action potentials were blanked. (B) Scatter plot shows averaged EPSC amplitudes (n = 46, 46, 64, 64; respectively). (C) Scatter plot shows averaged paired-pulse ratio (PPR) at 100 Hz (n = 46, 64; respectively) (D) Representative fit of the decay of the 2nd EPSCs of paired-pulse responses of Syt1 KO (red) and R398, 399Q mutant (black). EPSCs were scaled and fitted with double exponential functions (see method). (E) Scatter plot shows averaged weighted time constant (τ) of the decays of 2nd EPSC (n = 46, 64; respectively). (F) Representative traces of paired-pulse responses with various inter-pulse intervals (10, 25, 100, 500 ms) in R398, 399Q mutant. Scaled 1st and 2nd EPSC response at 10 ms (red), ms (blue) and 500 ms (black). (G) Release synchronicity ratio (black) and paired-pulse ratio (red) of 1st EPSC and 2nd EPSC in R398, 399Q mutant with 10, 25, (50), 100, 500 ms inter-pulse intervals (n = 34, 51, 17, 49, 47; respectively; see Material and methods). Time course of the release synchronicity (black) and short-term facilitation (red) were obtained by fitting the data points with single-exponential functions. Time constants of exponential fits are shown. (H) Representative paired-pulse EPSCs traces (10 ms apart) of Syt1 KO rescued with wild-type full length (FL) (red) and R398, 399Q mutant (black) in the presence of 1 and 10 mM external Ca2+. (I) Averaged decay time constant (τ) of the 2nd EPSCs of the paired-pulse responses recorded in the presence of 1, 2, 4 and 10 mM external Ca2+ in Syt1 FL (red; n = 31, 31, 31, 28) or R398, 399Q (black; n = 36, 39, 41, 27) rescued Syt1 KO neurons. Data were fitted with nonlinear logistic Hill equation. (J) Normalized traces of 2nd EPSC of the paired-pulse responses in Syt1 FL (red) or R398, 399Q mutant (black) rescued neurons. (K) Normalized 2nd EPSC of the paired-pulse responses in R398, 399Q mutant in the presence of 1 (black), 2 (grey), 4 (blue) and 10 (red) mM external Ca2+. (L) Correlation of SV number within 0-5 nm to the AZ and release rate of the 2nd EPSC in the paired-pulse responses. Data were normalized to the resting condition of R398, 399Q mutant. n represents the number cells analyzed. Data were obtained from neurons from at least 3 independent cultures and shown as mean ± SEM. Statistical significance was assessed by student t-test or Mann-Whitney test. ***p < 0.001; ns: not significant. For detailed numbers and statistical analysis, see Supplementary Table 1E-K.
Fig. 4
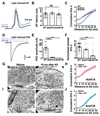
Fig. 4. Ca2+-induced Syt1 docking requires assembly of SNARE complex
(A) Representative AP traces of WT (black), BoNT/A (pink) or BoNT/B (blue) treated WT mass-cultured neurons elicited by a pulse of light (10 ms; light blue). Data were obtained from recordings in current-clamp mode (B) Scatter plot shows averaged latency for AP generation (n = 19, 20, 20; respectively) (C) Cumulative distribution of the SVs (D) Representative postsynaptic currents (PSC) of WT (black) BoNT/A (pink) or BoNT/B (blue) treated WT neurons triggered by a pulse of light (10 ms; light blue). Responses were subtracted with the ChR2 photocurrents obtained by blocking the PSC current with extracellular solution containing 3 μM NBQX and 30 μM bicuculline (n = 19, 20, 20; respectively) (E) Scatter plot shows averaged PSC amplitudes (n = 19, 20, 20; respectively) (F) Normalized docked vesicle number. Data were normalized to the AZ lengths. (G) Representative electron micrographs of BoNT/A or (I) BoNT/B-treated WT synapses before and 10 ms after AP. Scale bar: 100 nm. (H) Cumulative distributions of vesicles of BoNT/A treated WT mass-cultured neurons before (n = 206) and after 1AP (n = 224) or of (J) BoNT/B treated neurons before (n = 229) and after AP (n = 201). In (B, E) n represents the number cells analyzed. In (C, F, H, J), n represents the number of electron micrographs (synapses) analyzed. Data were obtained from neurons from at least 3 independent cultures and are shown as mean ± SEM. Statistical significance was assessed by Kruskal-Wallis ANOVA test followed by Dunn’s multiple comparison test. ***p < 0.001; *p < 0.05; ns: not significant. For detailed numbers and statistical analysis, see Supplementary Table 1 L, M.

References

    1. Imig C, et al. The morphological and molecular nature of synaptic vesicle priming at presynaptic active zones. Neuron. 2014;84:416–431. doi: 10.1016/j.neuron.2014.10.009. - DOI - PubMed
    1. Jahn R, Fasshauer D. Molecular machines governing exocytosis of synaptic vesicles. Nature. 2012;490:201–207. doi: 10.1038/nature11320. - DOI - PMC - PubMed
    1. Sudhof TC. The synaptic vesicle cycle. Annu Rev Neurosci. 2004;27:509–547. doi: 10.1146/annurev.neuro.26.041002.131412. - DOI - PubMed
    1. Sudhof TC. Neurotransmitter release: the last millisecond in the life of a synaptic vesicle. Neuron. 2013;80:675–690. doi: 10.1016/j.neuron.2013.10.022. - DOI - PMC - PubMed
    1. Brose N, Petrenko AG, Sudhof TC, Jahn R. Synaptotagmin: a calcium sensor on the synaptic vesicle surface. Science. 1992;256:1021–1025. - PubMed

Publication types

MeSH terms

LinkOut - more resources