A novel approach for human whole transcriptome analysis based on absolute gene expression of microarray data
- PMID: 29230367
- PMCID: PMC5724404
- DOI: 10.7717/peerj.4133
A novel approach for human whole transcriptome analysis based on absolute gene expression of microarray data
Abstract
Background: In spite of the emergence of RNA sequencing (RNA-seq), microarrays remain in widespread use for gene expression analysis in the clinic. There are over 767,000 RNA microarrays from human samples in public repositories, which are an invaluable resource for biomedical research and personalized medicine. The absolute gene expression analysis allows the transcriptome profiling of all expressed genes under a specific biological condition without the need of a reference sample. However, the background fluorescence represents a challenge to determine the absolute gene expression in microarrays. Given that the Y chromosome is absent in female subjects, we used it as a new approach for absolute gene expression analysis in which the fluorescence of the Y chromosome genes of female subjects was used as the background fluorescence for all the probes in the microarray. This fluorescence was used to establish an absolute gene expression threshold, allowing the differentiation between expressed and non-expressed genes in microarrays.
Methods: We extracted the RNA from 16 children leukocyte samples (nine males and seven females, ages 6-10 years). An Affymetrix Gene Chip Human Gene 1.0 ST Array was carried out for each sample and the fluorescence of 124 genes of the Y chromosome was used to calculate the absolute gene expression threshold. After that, several expressed and non-expressed genes according to our absolute gene expression threshold were compared against the expression obtained using real-time quantitative polymerase chain reaction (RT-qPCR).
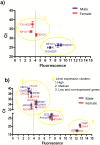
Results: From the 124 genes of the Y chromosome, three genes (DDX3Y, TXLNG2P and EIF1AY) that displayed significant differences between sexes were used to calculate the absolute gene expression threshold. Using this threshold, we selected 13 expressed and non-expressed genes and confirmed their expression level by RT-qPCR. Then, we selected the top 5% most expressed genes and found that several KEGG pathways were significantly enriched. Interestingly, these pathways were related to the typical functions of leukocytes cells, such as antigen processing and presentation and natural killer cell mediated cytotoxicity. We also applied this method to obtain the absolute gene expression threshold in already published microarray data of liver cells, where the top 5% expressed genes showed an enrichment of typical KEGG pathways for liver cells. Our results suggest that the three selected genes of the Y chromosome can be used to calculate an absolute gene expression threshold, allowing a transcriptome profiling of microarray data without the need of an additional reference experiment.
Discussion: Our approach based on the establishment of a threshold for absolute gene expression analysis will allow a new way to analyze thousands of microarrays from public databases. This allows the study of different human diseases without the need of having additional samples for relative expression experiments.
Keywords: Absolute gene expression; Human; Leukocyte; Microarray; Personalized medicine; Transcriptome; Transcriptomics.
Conflict of interest statement
The authors declare there are no competing interests.
Figures


References
-
- Björling E, Lindskog C, Oksvold P, Linné J, Kampf C, Hober S, Uhlén M, Pontén F. A web-based tool for in silico biomarker discovery based on tissue-specific protein profiles in normal and cancer tissues. Molecular & Cellular Proteomics. 2008;7:825–844. doi: 10.1074/mcp.M700411-MCP200. - DOI - PubMed
LinkOut - more resources
Full Text Sources
Other Literature Sources
Molecular Biology Databases

