

EBV-encoded miRNAs target ATM-mediated response in nasopharyngeal carcinoma
- PMID: 29230817
- PMCID: PMC5888186
- DOI: 10.1002/path.5018
EBV-encoded miRNAs target ATM-mediated response in nasopharyngeal carcinoma
Abstract
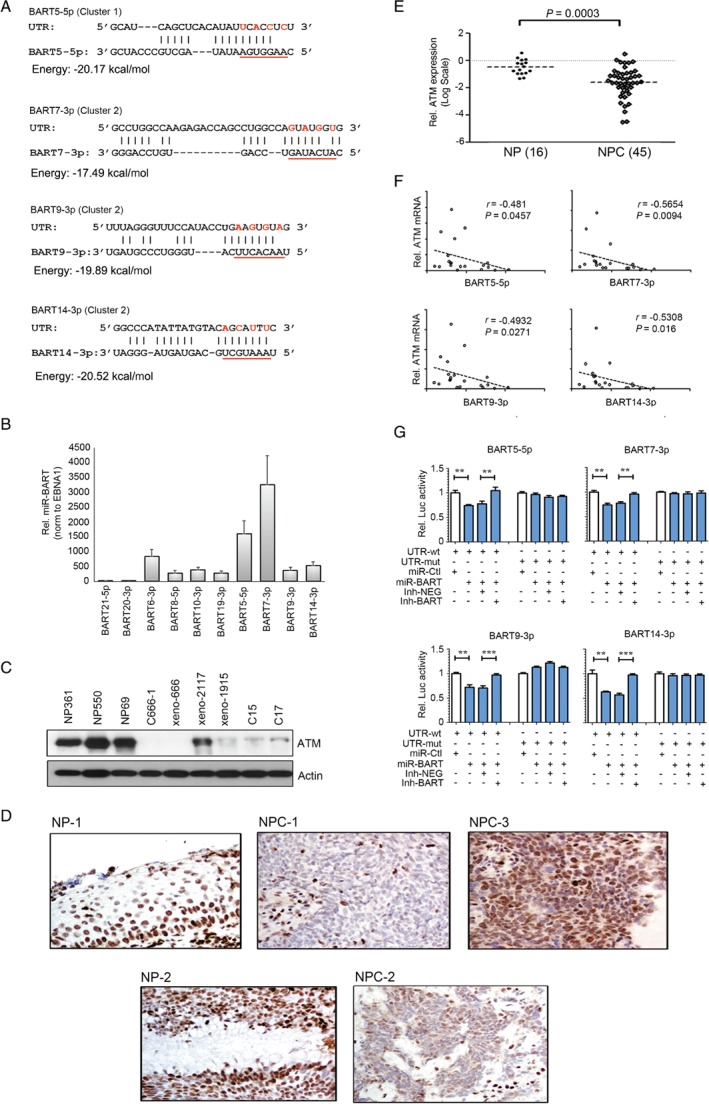
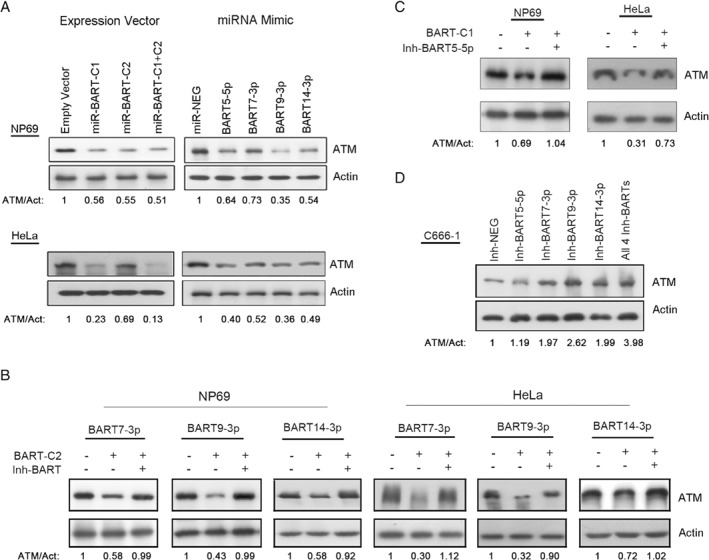
Nasopharyngeal carcinoma (NPC) is a highly invasive epithelial malignancy that is prevalent in southern China and Southeast Asia. It is consistently associated with latent Epstein-Barr virus (EBV) infection. In NPC, miR-BARTs, the EBV-encoded miRNAs derived from BamH1-A rightward transcripts, are abundantly expressed and contribute to cancer development by targeting various cellular and viral genes. In this study, we establish a comprehensive transcriptional profile of EBV-encoded miRNAs in a panel of NPC patient-derived xenografts and an EBV-positive NPC cell line by small RNA sequencing. Among the 40 miR-BARTs, predominant expression of 22 miRNAs was consistently detected in these tumors. Among the abundantly expressed EBV-miRNAs, BART5-5p, BART7-3p, BART9-3p, and BART14-3p could negatively regulate the expression of a key DNA double-strand break (DSB) repair gene, ataxia telangiectasia mutated (ATM), by binding to multiple sites on its 3'-UTR. Notably, the expression of these four miR-BARTs represented more than 10% of all EBV-encoded miRNAs in tumor cells, while downregulation of ATM expression was commonly detected in all of our tested sequenced samples. In addition, downregulation of ATM was also observed in primary NPC tissues in both qRT-PCR (16 NP and 45 NPC cases) and immunohistochemical staining (35 NP and 46 NPC cases) analysis. Modulation of ATM expression by BART5-5p, BART7-3p, BART9-3p, and BART14-3p was demonstrated in the transient transfection assays. These findings suggest that EBV uses miRNA machinery as a key mechanism to control the ATM signaling pathway in NPC cells. By suppressing these endogenous miR-BARTs in EBV-positive NPC cells, we further demonstrated the novel function of miR-BARTs in inhibiting Zta-induced lytic reactivation. These findings imply that the four viral miRNAs work co-operatively to modulate ATM activity in response to DNA damage and to maintain viral latency, contributing to the tumorigenesis of NPC. © 2017 The Authors. The Journal of Pathology published by John Wiley & Sons Ltd on behalf of Pathological Society of Great Britain and Ireland.
Keywords: ATM serine/threonine kinase (ATM); EBV-miRNAs; Epstein-Barr virus; nasopharyngeal carcinoma; transcriptome sequencing.
© 2017 The Authors. The Journal of Pathology published by John Wiley & Sons Ltd on behalf of Pathological Society of Great Britain and Ireland.
Figures


Similar articles
-
EBV-encoded miRNAs can sensitize nasopharyngeal carcinoma to chemotherapeutic drugs by targeting BRCA1.J Cell Mol Med. 2020 Nov;24(22):13523-13535. doi: 10.1111/jcmm.16007. Epub 2020 Oct 19. J Cell Mol Med. 2020. PMID: 33074587 Free PMC article.
-
NF-κB Signaling Regulates Expression of Epstein-Barr Virus BART MicroRNAs and Long Noncoding RNAs in Nasopharyngeal Carcinoma.J Virol. 2016 Jun 24;90(14):6475-88. doi: 10.1128/JVI.00613-16. Print 2016 Jul 15. J Virol. 2016. PMID: 27147748 Free PMC article.
-
Epstein-Barr Virus MicroRNA miR-BART5-3p Inhibits p53 Expression.J Virol. 2018 Nov 12;92(23):e01022-18. doi: 10.1128/JVI.01022-18. Print 2018 Dec 1. J Virol. 2018. PMID: 30209170 Free PMC article.
-
Emerging roles of small Epstein-Barr virus derived non-coding RNAs in epithelial malignancy.Int J Mol Sci. 2013 Aug 23;14(9):17378-409. doi: 10.3390/ijms140917378. Int J Mol Sci. 2013. PMID: 23979421 Free PMC article. Review.
-
The role of miRNAs and EBV BARTs in NPC.Semin Cancer Biol. 2012 Apr;22(2):166-72. doi: 10.1016/j.semcancer.2011.12.001. Epub 2011 Dec 10. Semin Cancer Biol. 2012. PMID: 22178394 Free PMC article. Review.
Cited by
-
EBV-miR-BART5-5p regulates RORA to promote proliferation and migration of gastric cancer cells.PLoS One. 2025 Jul 10;20(7):e0327323. doi: 10.1371/journal.pone.0327323. eCollection 2025. PLoS One. 2025. PMID: 40638694 Free PMC article.
-
Circulation EBV Mir-Bart-7 Relating to Clinical Manifestation in Nasopharyngeal Carcinoma.Asian Pac J Cancer Prev. 2020 Sep 1;21(9):2777-2782. doi: 10.31557/APJCP.2020.21.9.2777. Asian Pac J Cancer Prev. 2020. PMID: 32986380 Free PMC article.
-
EBV-encoded miRNAs can sensitize nasopharyngeal carcinoma to chemotherapeutic drugs by targeting BRCA1.J Cell Mol Med. 2020 Nov;24(22):13523-13535. doi: 10.1111/jcmm.16007. Epub 2020 Oct 19. J Cell Mol Med. 2020. PMID: 33074587 Free PMC article.
-
Hepatitis C Virus Mediated Inhibition of miR-181c Activates ATM Signaling and Promotes Hepatocyte Growth.Hepatology. 2020 Mar;71(3):780-793. doi: 10.1002/hep.30893. Epub 2019 Nov 3. Hepatology. 2020. PMID: 31400158 Free PMC article.
-
MicroRNAs as Therapeutic Targets in Nasopharyngeal Carcinoma.Front Oncol. 2019 Aug 13;9:756. doi: 10.3389/fonc.2019.00756. eCollection 2019. Front Oncol. 2019. PMID: 31456943 Free PMC article. Review.
References
-
- Chan AT, Felip E, Group EGW . Nasopharyngeal cancer: ESMO clinical recommendations for diagnosis, treatment and follow‐up. Ann Oncol 2009; 20(suppl 4): 123–125. - PubMed
-
- Raab‐Traub N. Epstein–Barr virus in the pathogenesis of NPC. Semin Cancer Biol 2002; 12 : 431–441. - PubMed
-
- Lo KW, Chung GT, To KF. Deciphering the molecular genetic basis of NPC through molecular, cytogenetic, and epigenetic approaches. Semin Cancer Biol 2012; 22 : 79–86. - PubMed
-
- Lo AK, Dawson CW, Young LS, et al Activation of the FGFR1 signalling pathway by the Epstein–Barr virus‐encoded LMP1 promotes aerobic glycolysis and transformation of human nasopharyngeal epithelial cells. J Pathol 2015; 237 : 238–248. - PubMed
-
- Raab‐Traub N. Nasopharyngeal carcinoma: an evolving role for the Epstein–Barr virus. Curr Top Microbiol Immunol 2015; 390 : 339–363. - PubMed
Publication types
MeSH terms
Substances
Grants and funding
LinkOut - more resources
Full Text Sources
Other Literature Sources
Medical
Research Materials
Miscellaneous
