

Dynamic prediction in functional concurrent regression with an application to child growth
- PMID: 29230836
- PMCID: PMC5847461
- DOI: 10.1002/sim.7582
Dynamic prediction in functional concurrent regression with an application to child growth
Abstract
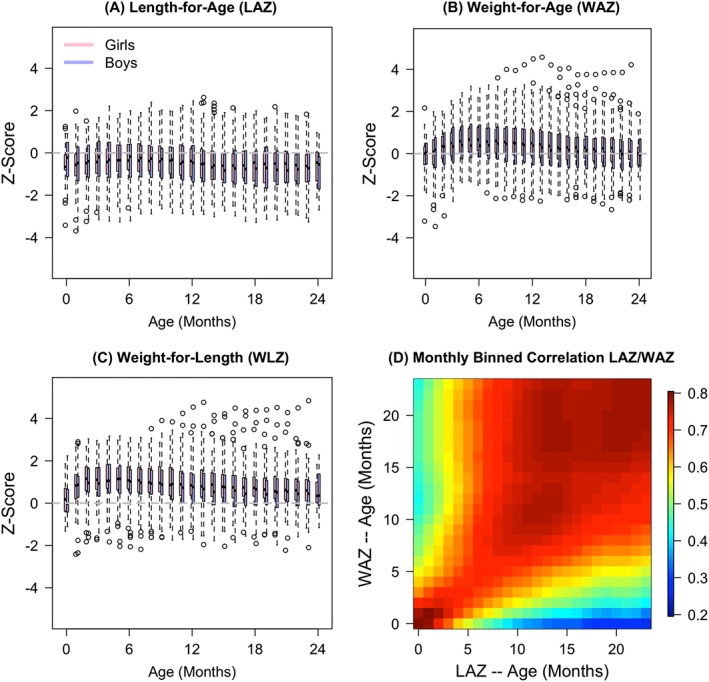
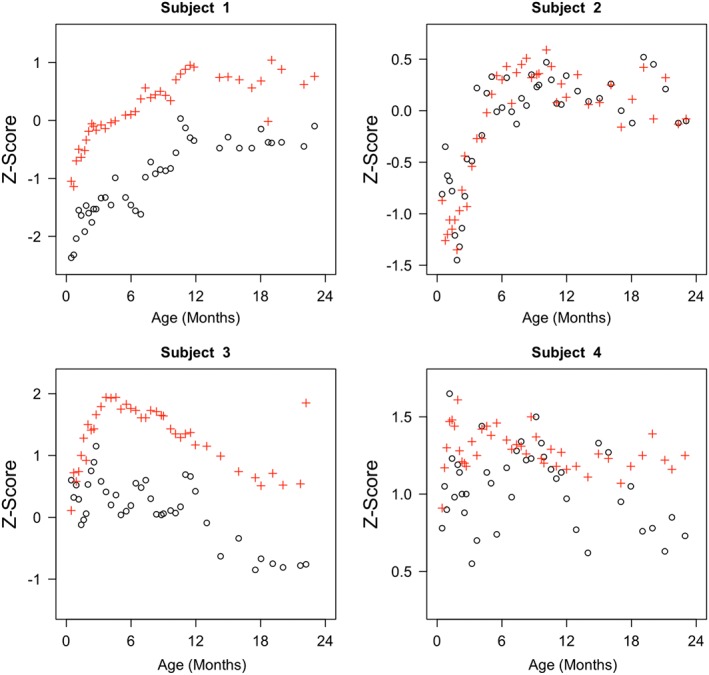
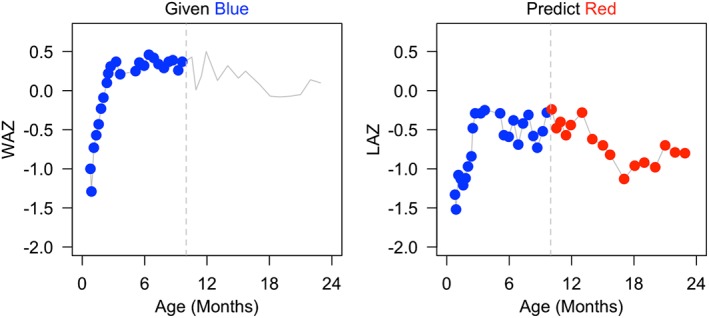
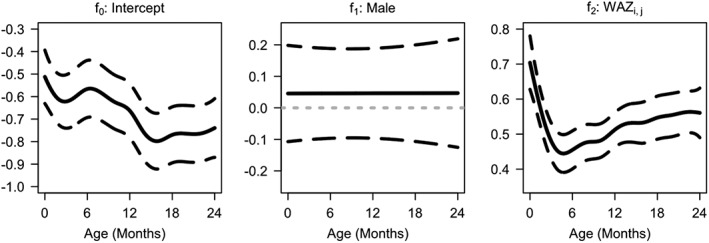
In many studies, it is of interest to predict the future trajectory of subjects based on their historical data, referred to as dynamic prediction. Mixed effects models have traditionally been used for dynamic prediction. However, the commonly used random intercept and slope model is often not sufficiently flexible for modeling subject-specific trajectories. In addition, there may be useful exposures/predictors of interest that are measured concurrently with the outcome, complicating dynamic prediction. To address these problems, we propose a dynamic functional concurrent regression model to handle the case where both the functional response and the functional predictors are irregularly measured. Currently, such a model cannot be fit by existing software. We apply the model to dynamically predict children's length conditional on prior length, weight, and baseline covariates. Inference on model parameters and subject-specific trajectories is conducted using the mixed effects representation of the proposed model. An extensive simulation study shows that the dynamic functional regression model provides more accurate estimation and inference than existing methods. Methods are supported by fast, flexible, open source software that uses heavily tested smoothing techniques.
Keywords: covariance function; fPCA; face; longitudinal data; mixed effects; penalized splines; sparse functional data.
© 2017 The Authors. Statistics in Medicine Published by John Wiley & Sons Ltd.
Figures

Similar articles
-
Quantile regression methods for reference growth charts.Stat Med. 2006 Apr 30;25(8):1369-82. doi: 10.1002/sim.2271. Stat Med. 2006. PMID: 16143984
-
A penalized spline approach to functional mixed effects model analysis.Biometrics. 2011 Sep;67(3):861-70. doi: 10.1111/j.1541-0420.2010.01524.x. Epub 2010 Dec 14. Biometrics. 2011. PMID: 21155747
-
Subject-specific prediction using nonlinear population modeling: application to early brain maturation from DTI.Med Image Comput Comput Assist Interv. 2014;17(Pt 3):33-40. doi: 10.1007/978-3-319-10443-0_5. Med Image Comput Comput Assist Interv. 2014. PMID: 25320779 Free PMC article.
-
[Development and application of 2006 WHO Child Growth Standards].Zhonghua Er Ke Za Zhi. 2013 Sep;51(9):704-7. Zhonghua Er Ke Za Zhi. 2013. PMID: 24330996 Review. Chinese. No abstract available.
-
4.1 The WHO Child Growth Standards.World Rev Nutr Diet. 2015;113:278-94. doi: 10.1159/000360352. World Rev Nutr Diet. 2015. PMID: 25906897 Review. No abstract available.
Cited by
-
Impact of the COVID-19 induced lockdown measures on concentration in USA.Atmos Environ (1994). 2021 Jun 1;254:118388. doi: 10.1016/j.atmosenv.2021.118388. Epub 2021 Apr 7. Atmos Environ (1994). 2021. PMID: 33841026 Free PMC article.
-
Instrumental variable estimation for functional concurrent regression models.J Appl Stat. 2023 Jul 2;51(8):1570-1589. doi: 10.1080/02664763.2023.2229968. eCollection 2024. J Appl Stat. 2023. PMID: 38863803 Free PMC article.
-
Dynamic ensemble prediction of cognitive performance in spaceflight.Sci Rep. 2022 Jun 30;12(1):11032. doi: 10.1038/s41598-022-14456-8. Sci Rep. 2022. PMID: 35773291 Free PMC article.
-
Forecasting the Regional Demand for Medical Workers in Kazakhstan: The Functional Principal Component Analysis Approach.Int J Environ Res Public Health. 2025 Jun 30;22(7):1052. doi: 10.3390/ijerph22071052. Int J Environ Res Public Health. 2025. PMID: 40724119 Free PMC article.
-
A Study of Pupil Response to Light as a Digital Biomarker of Recent Cannabis Use.Digit Biomark. 2024 Apr 26;8(1):83-92. doi: 10.1159/000538561. eCollection 2024 Jan-Dec. Digit Biomark. 2024. PMID: 38682092 Free PMC article.
References
-
- Liang K, Zeger S. Longtitudinal data analysis using generalized linear models. Biometrika. 1986;73(1):13‐22.
-
- Laird N, Ware J. Random‐effects models for longitudinal data. Biometrics. 1982;38(4):963‐974. - PubMed
-
- Lindstrom M, Bates D. Nonlinear mixed effects models for repeated measures data. Biometrics. 1990;46(3):673‐687. - PubMed
-
- Davidian M, Giltinan D. Nonlinear Models for Repeated Measurement Data. New York: Chapman and Hall; 1995.
Publication types
MeSH terms
Grants and funding
LinkOut - more resources
Full Text Sources
Other Literature Sources