. 2018 Feb;38(2):230-240.
doi: 10.1177/0271678X17747833. Epub 2017 Dec 12.

Dynamic autoregulation of cerebral blood flow measured non-invasively with fast diffuse correlation spectroscopy

Affiliations

Dynamic autoregulation of cerebral blood flow measured non-invasively with fast diffuse correlation spectroscopy

Ashwin B Parthasarathy et al. J Cereb Blood Flow Metab. 2018 Feb.

Abstract

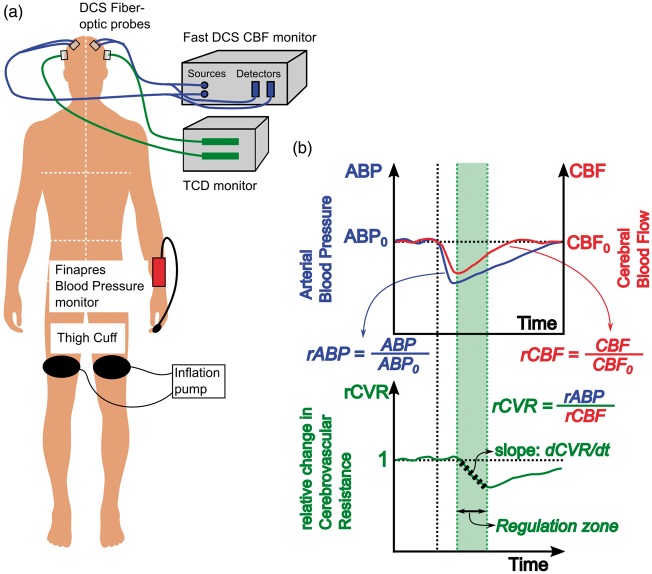
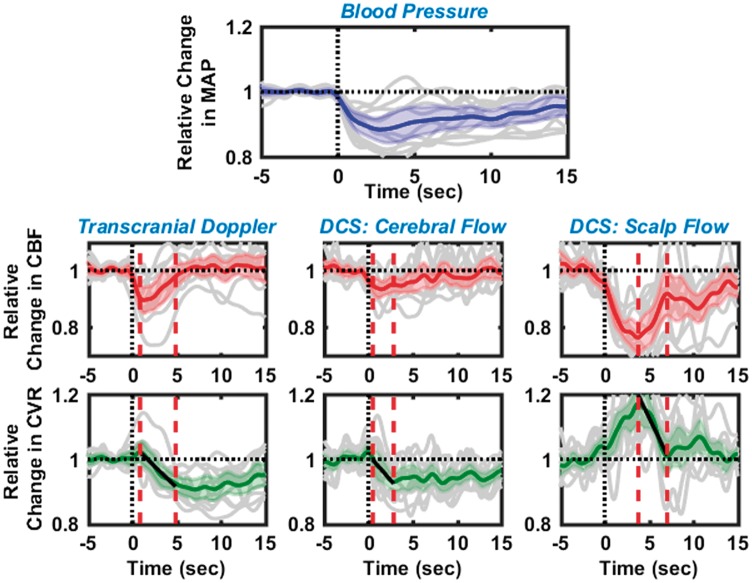
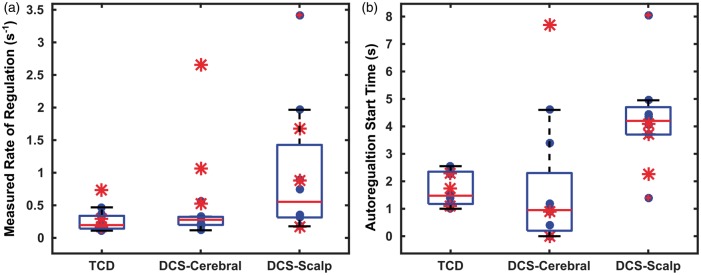
Cerebral autoregulation (CA) maintains cerebral blood flow (CBF) in the presence of systemic blood pressure changes. Brain injury can cause loss of CA and resulting dysregulation of CBF, and the degree of CA impairment is a functional indicator of cerebral tissue health. Here, we demonstrate a new approach to noninvasively estimate cerebral autoregulation in healthy adult volunteers. The approach employs pulsatile CBF measurements obtained using high-speed diffuse correlation spectroscopy (DCS). Rapid thigh-cuff deflation initiates a chain of responses that permits estimation of rates of dynamic autoregulation in the cerebral microvasculature. The regulation rate estimated with DCS in the microvasculature (median: 0.26 s-1, inter quartile range: 0.19 s-1) agrees well (R = 0.81, slope = 0.9) with regulation rates measured by transcranial Doppler ultrasound (TCD) in the proximal vasculature (median: 0.28 s-1, inter quartile range: 0.10 s-1). We also obtained an index of systemic autoregulation in concurrently measured scalp microvasculature. Systemic autoregulation begins later than cerebral autoregulation and exhibited a different rate (0.55 s-1, inter quartile range: 0.72 s-1). Our work demonstrates the potential of diffuse correlation spectroscopy for bedside monitoring of cerebral autoregulation in the microvasculature of patients with brain injury.

Keywords: Cerebral blood flow; cerebral autoregulation; intrinsic optical imaging; neurocritical care; noninvasive monitoring.


Figures

Figure 1.
Figure 1.
(a) Schematic of dynamic autoregulation measurements using DCS. Optical blood flow measurements are realized with two fiber optic probes attached to the frontal regions of the head (blue lines), while TCD blood flow velocity measurements are realized using transducers placed over the temporal bone (green lines). Arterial blood pressure is measured using a commercial Finapres Blood pressure monitor attached to the subject’s finger. (b) Schematic that describes data and analysis of hemodynamic waveforms to estimate rate of dynamic autoregulation. Solid blue and red lines denote the measured mean arterial pressure and cerebral blood flow (either DCS or TCD). Black vertical dotted line denotes the time of cuff deflation. The bottom curve denotes the relative change in cerebrovascular resistance derived from relative changes in pressure and flow. The shaded green region depicts the ‘autoregulation region’, i.e. the time at which cerebral resistance decreases and cerebral blood flow increases. Black dashed line within the autoregulation zone represents a linear fit to the change in resistance, the slope of which is used to estimate the rate of dynamic autoregulation.
Figure 2.
Figure 2.
Dynamic cerebral autoregulation estimated from 11 healthy subjects with the thigh cuff method, using relative blood flows measured with transcranial Doppler ultrasound (left), cerebral blood flow with optics (middle), and extra-cerebral/scalp blood flow with optics (right). Panel in the first row shows the corresponding changes in mean arterial blood pressure. In all panels, black dashed lines at time t = 0, represents the instant of cuff deflation, while solid gray lines depict the individual measurements. Solid blue, red, and green lines are the averaged relative changes in blood pressure, blood flow and cerebrovascular resistance, respectively; 95% confidence intervals of these averages are marked by the shaded region in the corresponding color. ‘Autoregulation times’ are denoted by the red dashed vertical lines; measurements during these times were used to estimate the rate of regulation.
Figure 3.
Figure 3.
Box plots depicting rate of regulation (a) and autoregulation start times (b), as estimated using TCD, DCS cerebral blood flow, and DCS extra-cerebral/scalp blood flow. Individual data points are depicted using a filled blue circle (formula image, n = 8). Outliers (not included in the analysis, see text) are marked with red asterisk (formula image). Horizontal red line in each box represents the median of measurements, while horizontal blue lines represent the 75th and 25th quartile.
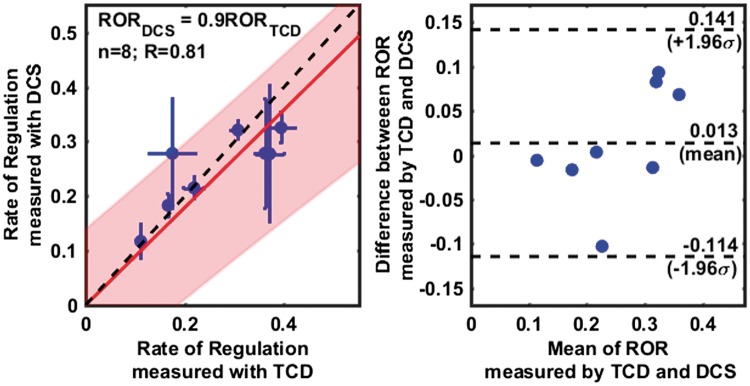
Figure 4.
Figure 4.
Comparison of the rates of regulation measured using TCD and DCS (cerebral), excluding outliers. A scatter plot on the left panel, shows a linear relationship (R = 0.81) between RORTCD and RORDCS. Individual data points are shown with a blue circle (horizontal and vertical error bars indicate uncertainties in the estimate of ROR as measured by TCD and DCS), with a linear fit line (solid red), the 95% confidence interval of linear fit (shaded red region) and a 1:1 line (dashed black). The slope of the regression line was estimated to be 0.9 ± 0.18. A Bland–Altman plot in right panel shows the distribution of individual measurements between 95% confidence intervals for agreement (top, and bottom dashed horizontal lines), as well as a small error (0.01) between the measurements (middle dashed horizontal line), that is not significantly different from zero (see also, Supplemental Figure 2).

References

    1. Strandgaard S, Paulson OB. Cerebral autoregulation. Stroke 1984; 15: 413–416. - PubMed
    1. Budohoski KP, Czosnyka M, Kirkpatrick PJ, et al. Clinical relevance of cerebral autoregulation following subarachnoid haemorrhage. Nat Rev Neurol 2013; 9: 152–163. - PubMed
    1. Aoi MC, Hu K, Lo M-T, et al. Impaired cerebral autoregulation is associated with brain atrophy and worse functional status in chronic ischemic stroke. PLoS One 2012; 7: e46794. - PMC - PubMed
    1. Atkins ER, Brodie FG, Rafelt SE, et al. Dynamic cerebral autoregulation is compromised acutely following mild ischaemic stroke but not transient ischaemic attack. Cerebrovasc Dis 2009; 29: 228–235. - PubMed
    1. Dawson SL, Blake MJ, Panerai RB, et al. Dynamic but not static cerebral autoregulation is impaired in acute ischaemic stroke. Cerebrovasc Dis 2000; 10: 126–132. - PubMed

Publication types