. 2017 Dec 12;18(1):964.
doi: 10.1186/s12864-017-4353-7.

DNA methylation regulates discrimination of enhancers from promoters through a H3K4me1-H3K4me3 seesaw mechanism

Affiliations

DNA methylation regulates discrimination of enhancers from promoters through a H3K4me1-H3K4me3 seesaw mechanism

Ali Sharifi-Zarchi et al. BMC Genomics. .

Abstract

Background: DNA methylation at promoters is largely correlated with inhibition of gene expression. However, the role of DNA methylation at enhancers is not fully understood, although a crosstalk with chromatin marks is expected. Actually, there exist contradictory reports about positive and negative correlations between DNA methylation and H3K4me1, a chromatin hallmark of enhancers.

Results: We investigated the relationship between DNA methylation and active chromatin marks through genome-wide correlations, and found anti-correlation between H3K4me1 and H3K4me3 enrichment at low and intermediate DNA methylation loci. We hypothesized "seesaw" dynamics between H3K4me1 and H3K4me3 in the low and intermediate DNA methylation range, in which DNA methylation discriminates between enhancers and promoters, marked by H3K4me1 and H3K4me3, respectively. Low methylated regions are H3K4me3 enriched, while those with intermediate DNA methylation levels are progressively H3K4me1 enriched. Additionally, the enrichment of H3K27ac, distinguishing active from primed enhancers, follows a plateau in the lower range of the intermediate DNA methylation level, corresponding to active enhancers, and decreases linearly in the higher range of the intermediate DNA methylation. Thus, the decrease of the DNA methylation switches smoothly the state of the enhancers from a primed to an active state. We summarize these observations into a rule of thumb of one-out-of-three methylation marks: "In each genomic region only one out of these three methylation marks {DNA methylation, H3K4me1, H3K4me3} is high. If it is the DNA methylation, the region is inactive. If it is H3K4me1, the region is an enhancer, and if it is H3K4me3, the region is a promoter". To test our model, we used available genome-wide datasets of H3K4 methyltransferases knockouts. Our analysis suggests that CXXC proteins, as readers of non-methylated CpGs would regulate the "seesaw" mechanism that focuses H3K4me3 to unmethylated sites, while being repulsed from H3K4me1 decorated enhancers and CpG island shores.

Conclusions: Our results show that DNA methylation discriminates promoters from enhancers through H3K4me1-H3K4me3 seesaw mechanism, and suggest its possible function in the inheritance of chromatin marks after cell division. Our analyses suggest aberrant formation of promoter-like regions and ectopic transcription of hypomethylated regions of DNA. Such mechanism process can have important implications in biological process in where it has been reported abnormal DNA methylation status such as cancer and aging.

Keywords: Computational epigenomics; DNA methylation; Enhancers; H3K4me1; H3K4me3; Histone modifications; Next generation sequencing; Promoters.


Conflict of interest statement

Ethics approval and consent to participate

Not applicable.

Consent for publication

Not applicable.

Competing interests

The authors declare that they have no competing interests.

Publisher’s Note

Springer Nature remains neutral with regard to jurisdictional claims in published maps and institutional affiliations.

Figures
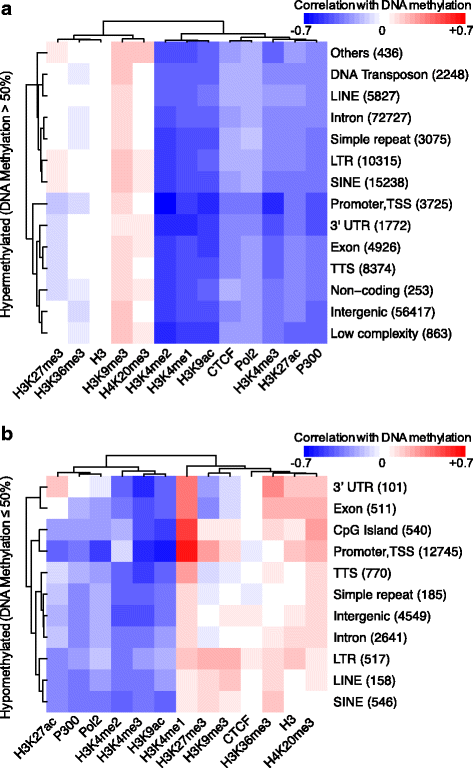
Fig. 1
Fig. 1
Correlation of chromatin marks and gene transcription regulators with DNA methylation in promoters and putative enhancers. The promoters are labeled as Promoter, TSS. The putative enhancers are distributed across different classes including repeat-associated regions {Short Interspersed Nuclear Element (SINE), Long Interspersed Nuclear Element (LINE), Simple repeat, Long Terminal Repeat (LTR), DNA Transposon, Low complexity, DNA Transposon}, Intergenic, Intron, coding regions {Exon, 3’UTR, Transcription Termination Site (TTS)}, Non-coding regions, CpG island, and Others. The promoters and different classes of enhancers are split into (a) DNA hypermethylated (DNA methylation >0.5) and (b) DNA hypomethylated (DNA methylation ≤0.5) groups. In each DNA methylation group, regulatory sites are classified based on their genomic location (rows). For each class, Spearman’s rank correlations, ρ, between DNA methylation of ESCs and 9 different chromatin marks, the repressive histone 3 (H3), the gene transcription marker RNA polymerase 2 (Pol2), the enhancer marker histone acetyltransferase P300, and insulator marker CCCTC-binding factor are presented in columns. Red, white and blue colors show positive, null and negative correlations, respectively
Fig. 2
Fig. 2
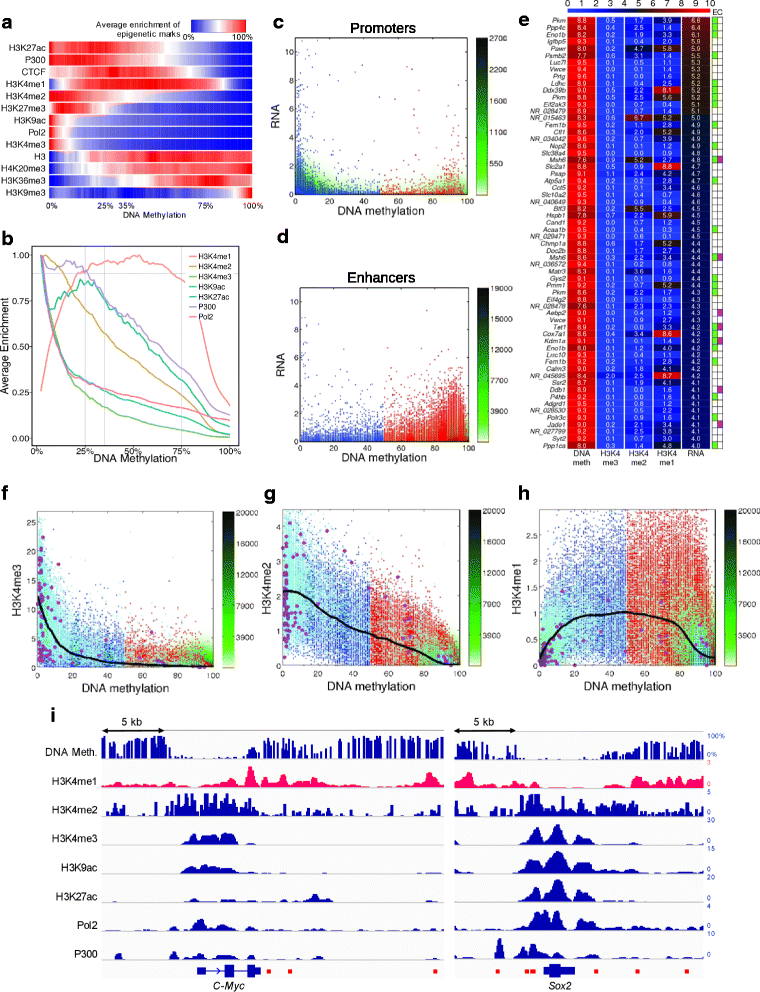
Distinct deposition of H3K4me1 from the other active chromatin marks. The regulatory sites are sorted according to their DNA methylation level in ESCs from 0 to 100% methylated. Average enrichment of different chromatin marks (rows) over sites of the same DNA methylation level are shown with (a) color bars and (b) lines (for the seven active chromatin marks). Average enrichments are scaled to have equal maximum for different marks. Pairwise scatter plots of DNA methylation versus RNA transcription for promoters (c) and enhancers (d). The scattering density is shown in green. Red and blue dots show sites with DNA methylation lower or higher that 50%, respectively. Cyan spreads show promoter sites and magenta circles show the promoters whose transcription is more than 4 in log2 scale. (e) Heat map of hypermethylated enhancers (DNA methylation >75%) and expressed transcripts (transcription >4 in log2 scale). To adjust the color codification, the DNA methylation, percentages are multiplied by 0.1, and H3K4me2 and H3K4me2 peaks by 5, the RNA-seq values are in log2 scale. Higher values correspond to redder color. The table to the right annotates Gene Ontology (GO) terms: E (Enzymatic activity) in green and C (Chromatin organization regulation) in magenta. H3K4 methylation, me3 (f), me2 (g) and me1 (h), enrichments within regulatory sites versus DNA methylation. Each point represents a single regulatory site. Each point represents a single regulatory site. The scattering density is shown in green. Red and blue dots show sites with DNA methylation lower or higher that 50%, respectively. Cyan spreads show promoter sites and magenta circles show the promoters whose transcription is more than 4 in log2 scale. The over imposed black lines mark the median of the H3K4 methylations smoothed using a robust loess regression. (i) DNA methylation and enrichment of the seven active chromatin marks around the Myc and Sox2 gene loci. The location of all known putative Myc and Sox2 enhancers taken from the supplemental material of Shen et al. [45] and from PHANTOM5 [46], are marked by red bars at the bottom. The y-axis represents the DNA methylation measured as the percentage of reads that support the methylated state of each CpG (estimated methylation level). For each histone mark track and for the Pol2 and P300 tracks, the y-axis represents the normalized level of ChIP-seq signal over the genomic regions
Fig. 3
Fig. 3
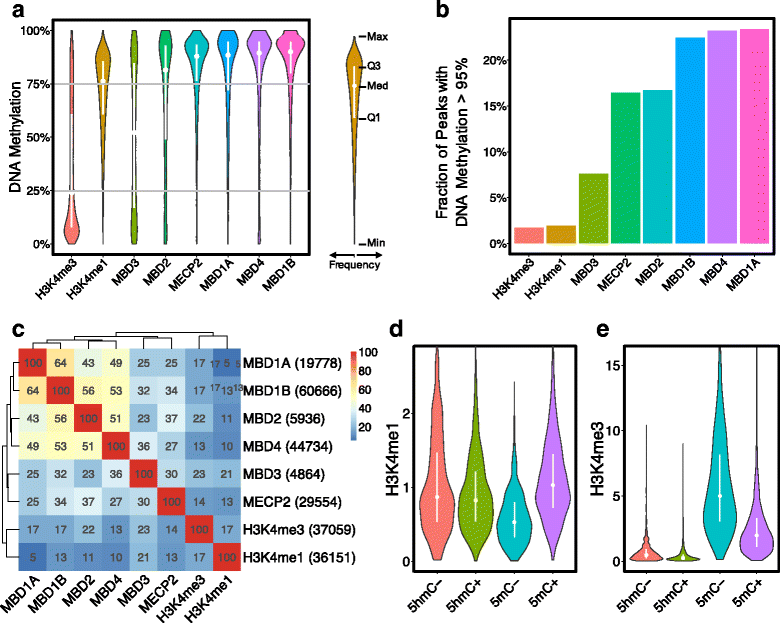
Correlation analysis enriched sites of H3K4 methylation, DNA methyl binding proteins (MBD3, MBD2, MECP2 MBD1A, MBD4 and MBD1B), DNA 5mC and 5hmC. (a) Violin plots of the DNA methylation distribution (y-axis) within peaks of H3K4me1, H3K4me3, and MBD proteins. The vertical white segments inside the violins connect the first (Q1) and the third quartile (Q3), and the white point represents the median (Med) of the DNA methylation level of the peaks. (b) Bar plot of the fraction of the highly methylated peaks (DNA methylation >95%) among all peaks of H3K4me1 and H3K4me3, and MBD binding regions. (c) Heat map of number of pairwise overlaps between peaks of two signals (chromatin marks or protein binding), O SiSj (eq. 2), in %. The peak frequencies are shown in parentheses in the row labels. Alternations in (d) H3K4me1 and (e) H3K4me3 enrichment (y-axes) in the absence (−) or presence (+) of either 5mC or 5hmC (y-axes)
Fig. 4
Fig. 4
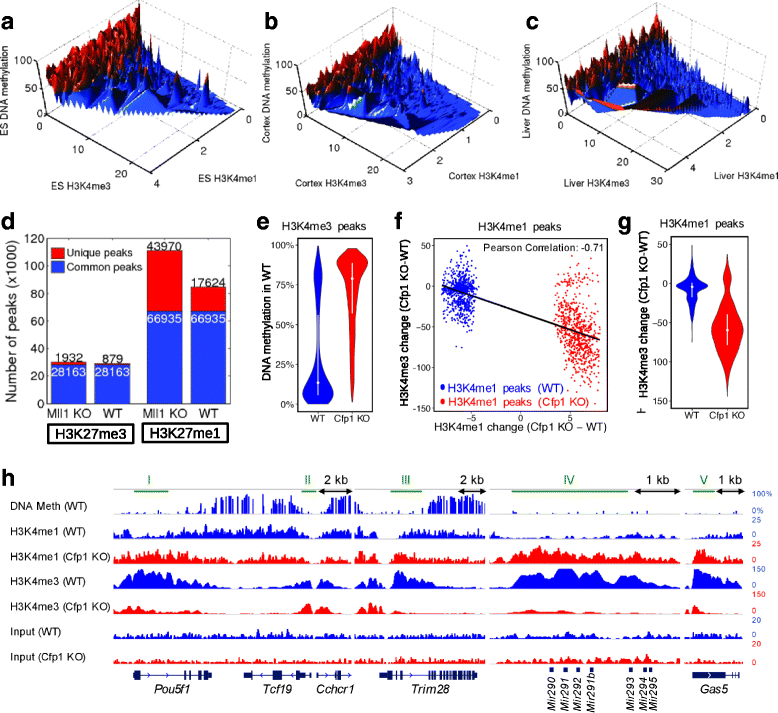
DNA methylation regulates the seesaw between H3K4me1 and H3K4me3. Surface of enrichment of H3K4me3 versus H34me1 within regulatory sites of (a) ESCs, (b) cortex, and (c) liver cells. Blue and red points represent regulatory sites with DNA methylation lower and higher than 50%, respectively. (d) Number of H3K4me1 and H3K27me3 peaks in WT and Mll1 KO MEF cells. (e) Distribution of the WT DNA methylation in genomic regions specifically enriched of H3K4me3 in WT or Cfp1 KO ESCs. (f) Scatter plot of the changes in H3K4me3 versus H3K4me1 enrichment (only for the H3K4me3/1 peaks with DNA methylation <50%) from WT to Cfp1 KO cells. Blue and red points represent H3K4me1 peaks specific to WT and Cfp1 KO cells, respectively. (g) Distribution of H3K4me3 changes for different H3K4me1 peaks (only for the H3K4me3/1 peaks with DNA methylation <75%) specific to WT or Cfp1 KO cells. (h) DNA methylation, H3K3me1 and H3K4me3 profiles of WT (blue tracks) and Cfp1 KO (red tracks) within several loci. Five genomic regions (I to V) approximately covering the gene promoters are indicated with green segments above charts. The y-axis represents the DNA methylation measured as the percentage of reads that support the methylated state of each CpG (estimated methylation level). For each histone mark track, the y-axis represents the normalized level of ChIP-seq signal over the genomic regions
Fig. 5
Fig. 5
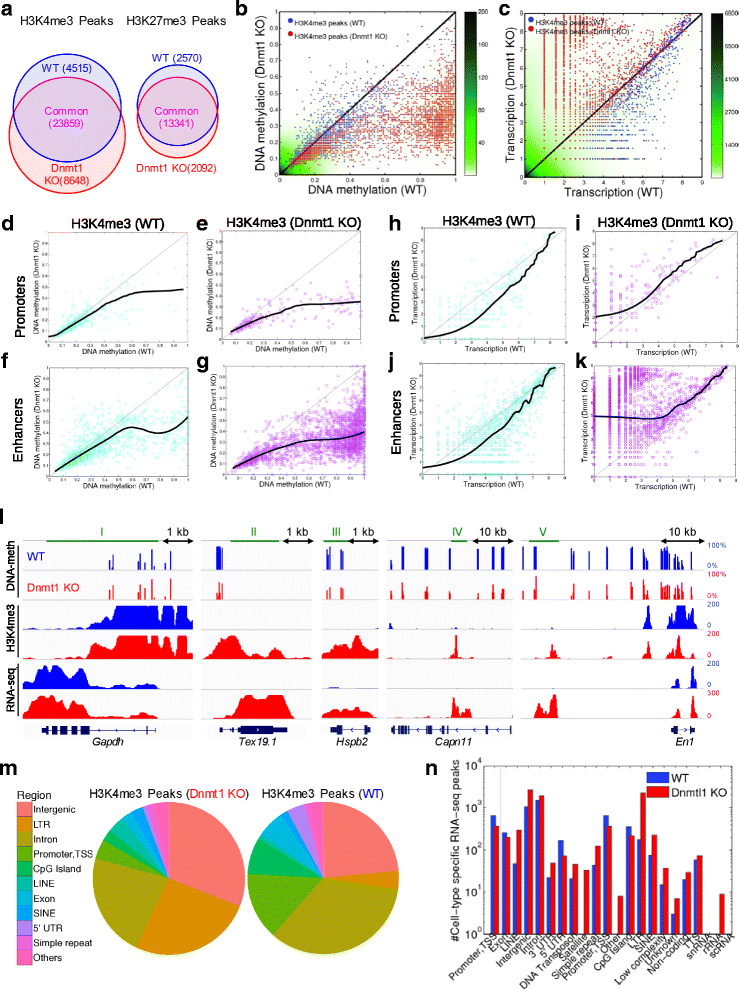
DNA hypomethylation is followed by H3K4me3 enrichment and activates transcription. (a) Venn diagrams of number of H3K4me3 (left) and H3K27me3 (right) peaks in WT and Dnmt1 KO MEF cells, in blue and red, respectively. (b) Scatter plot of DNA methylation profiles in Dnmt1 KO versus WT cells. (c) Scatter plot of RNA-Seq transcription profiles of Dnmt1 KO versus WT. The scattering density is shown in green. (d) Scatter plot of DNA methylation profiles in Dnmt1 KO versus WT cells for H3K4me peaks over promoters of WT cells. (e) Scatter plot of DNA methylation profiles in Dnmt1 KO versus WT cells for H3K4me peaks over promoters of Dnmt1 KO cells. (f) Scatter plot of DNA methylation profiles in Dnmt1 KO versus WT cells for H3K4me peaks over enhancers of WT cells. (g) Scatter plot of DNA methylation profiles in Dnmt1 KO versus WT cells for H3K4me peaks over enhancers of Dnmt1 KO cells. (h) Scatter plot of transcriptomics profiles in Dnmt1 KO versus WT cells for H3K4me peaks over promoters of WT cells. (i) Scatter plot of transcriptomics profiles in Dnmt1 KO versus WT cells for H3K4me peaks over promoters of Dnmt1 KO cells. (j) Scatter plot of transcriptomics profiles in Dnmt1 KO versus WT cells for H3K4me peaks over enhancers of WT cells. (k) Scatter plot of transcriptomics profiles in Dnmt1 KO versus WT cells for H3K4me peaks over enhancers of Dnmt1 KO cells. (l) DNA methylation, H3K4me3 and transcription in several loci of WT (blue tracks) and Dnmt1 KO (red tracks) MEF cells. Green bars above the gene map locate the CpG islands. The y-axis represents the DNA methylation measured as the percentage of reads that support the methylated state of each CpG (estimated methylation level). For each histone mark track, the y-axis represents the normalized level of ChIP-seq signal over the genomic regions. (m ) Pie charts of the genomic structural composition of the H3K4me3 peaks loci specific to WT and Dnmt1 KO cells. (n) Number of specific RNA-seq peaks in WT and Dnmt1 KO cells
Fig. 6
Fig. 6
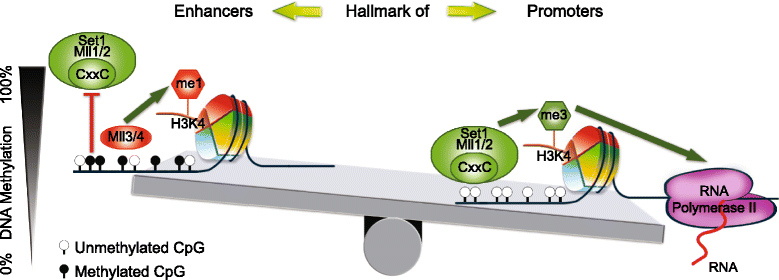
Scheme of how DNA methylation drives the seesaw mechanism between H3K4me1 and H3K4me3. CXXC binding domains including CFP1 and MLL1/2 are bound to unmethylated CpGs (right) and lead deposition of H3K4me3 (promoter mark), which results in RNA transcription. Increased DNA methylation (left) prevents binding of these CXXC domains, and the free nucleosomes can be bound by MLL3/4, which are not sensitive to methylation level, and transfer chromatin the enhancer mark H3K4me1. Decreased level of H3K4me3 due to DNA methylation coincides with a seesaw elevation of H3K4me1 and this is the mechanism behind positive correlation between DNA methylation and H3K4me1

Similar articles

Cited by

References

    1. Luu P-L, Schöler HR, Araúzo-Bravo MJ. Disclosing the crosstalk among DNA methylation, transcription factors, and histone marks in human pluripotent cells through discovery of DNA methylation motifs. Genome Res. 2013;23(12):2013–2029. doi: 10.1101/gr.155960.113. - DOI - PMC - PubMed
    1. Lienert F, Wirbelauer C, Som I, Dean A, Mohn F, Schübeler D. Identification of genetic elements that autonomously determine DNA methylation states. Nat Genet. 2011;43(11):1091–1097. doi: 10.1038/ng.946. - DOI - PubMed
    1. Zentner GE, Scacheri PC. The chromatin fingerprint of gene enhancer elements. J Biol Chem. 2012;287(37):30888–30896. doi: 10.1074/jbc.R111.296491. - DOI - PMC - PubMed
    1. Bulger M, Groudine M. Functional and mechanistic diversity of distal transcription enhancers. Cell. 2011;144(3):327–339. doi: 10.1016/j.cell.2011.01.024. - DOI - PMC - PubMed
    1. Jones PA. Functions of DNA methylation: islands, start sites, gene bodies and beyond. Nat Rev Genet. 2012;13(7):484–492. doi: 10.1038/nrg3230. - DOI - PubMed

LinkOut - more resources