

User testing of an adaptation of fishbone diagrams to depict results of systematic reviews
- PMID: 29233133
- PMCID: PMC5727698
- DOI: 10.1186/s12874-017-0452-z
User testing of an adaptation of fishbone diagrams to depict results of systematic reviews
Abstract
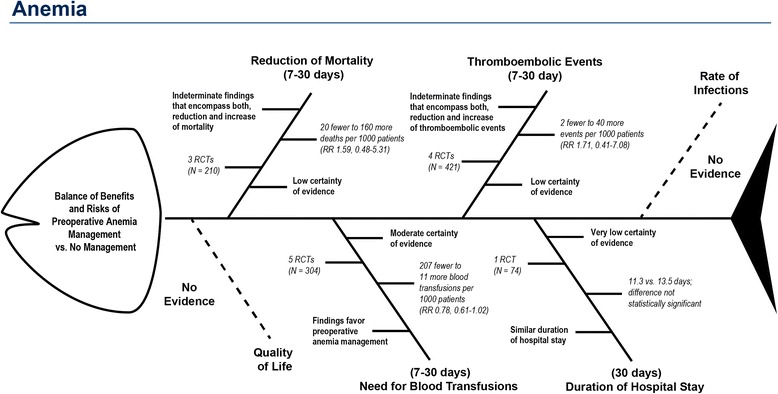
Background: Summary of findings tables in systematic reviews are highly informative but require epidemiological training to be interpreted correctly. The usage of fishbone diagrams as graphical displays could offer researchers an effective approach to simplify content for readers with limited epidemiological training. In this paper we demonstrate how fishbone diagrams can be applied to systematic reviews and present the results of an initial user testing.
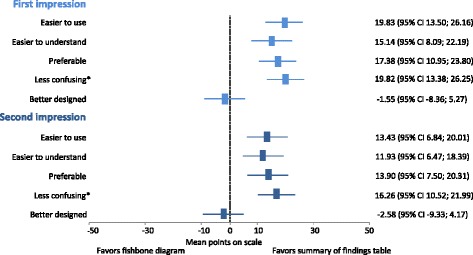
Methods: Findings from two systematic reviews were graphically depicted in the form of the fishbone diagram. To test the utility of fishbone diagrams compared with summary of findings tables, we developed and pilot-tested an online survey using Qualtrics. Respondents were randomized to the fishbone diagram or a summary of findings table presenting the same body of evidence. They answered questions in both open-ended and closed-answer formats; all responses were anonymous. Measures of interest focused on first and second impressions, the ability to find and interpret critical information, as well as user experience with both displays. We asked respondents about the perceived utility of fishbone diagrams compared to summary of findings tables. We analyzed quantitative data by conducting t-tests and comparing descriptive statistics.
Results: Based on real world systematic reviews, we provide two different fishbone diagrams to show how they might be used to display complex information in a clear and succinct manner. User testing on 77 students with basic epidemiological training revealed that participants preferred summary of findings tables over fishbone diagrams. Significantly more participants liked the summary of findings table than the fishbone diagram (71.8% vs. 44.8%; p < .01); significantly more participants found the fishbone diagram confusing (63.2% vs. 35.9%, p < .05) or indicated that it was difficult to find information (65.8% vs. 45%; p < .01). However, more than half of the participants in both groups were unable to find critical information and answer three respective questions correctly (52.6% in the fishbone group; 51.3% in the summary of findings group).
Conclusions: Fishbone diagrams are compact visualizations that, theoretically, may prove useful for summarizing the findings of systematic reviews. Initial user testing, however, did not support the utility of such graphical displays.
Keywords: Evidence summary; Fishbone diagram; Summary of findings; Systematic review; User testing; Visualization.
Conflict of interest statement
Ethics approval and consent to participate
The Danube University Institutional Review Board determined that ethics approval was not required. All students provided verbal informed consent and had sufficient time to consider participation in the study. Written informed consent was deemed unnecessary because no personal risk was involved and written consent is not normally sought for anonymous surveys.
Consent for publication
Not required.
Competing interests
Authors declare that they have no financial or non-financial competing interests.
Publisher’s Note
Springer Nature remains neutral with regard to jurisdictional claims in published maps and institutional affiliations.
Figures


References
-
- Guyatt GH, Thorlund K, Oxman AD, Walter SD, Patrick D, Furukawa TA, Johnston BC, Karanicolas P, Akl EA, Vist G. GRADE guidelines: 13. Preparing summary of findings tables and evidence profiles—continuous outcomes. J Clin Epidemiol. 2013;66(2):173–183. doi: 10.1016/j.jclinepi.2012.08.001. - DOI - PubMed
-
- Garcia-Retamero R, Cokely ET. Designing visual aids that promote risk literacy: a systematic review of health research and evidence-based design heuristics. Hum Factors. 2017:0018720817690634. - PubMed
-
- Ishikawa K, DJ L. What is total quality control?: the Japanese way, vol. 215. Englewood Cliffs, NJ: Prentice-Hall; 1985.
MeSH terms
Grants and funding
LinkOut - more resources
Full Text Sources
Other Literature Sources
