

DNA repair protein APE1 is involved in host response during pneumococcal meningitis and its expression can be modulated by vitamin B6
- PMID: 29233148
- PMCID: PMC5727666
- DOI: 10.1186/s12974-017-1020-5
DNA repair protein APE1 is involved in host response during pneumococcal meningitis and its expression can be modulated by vitamin B6
Abstract
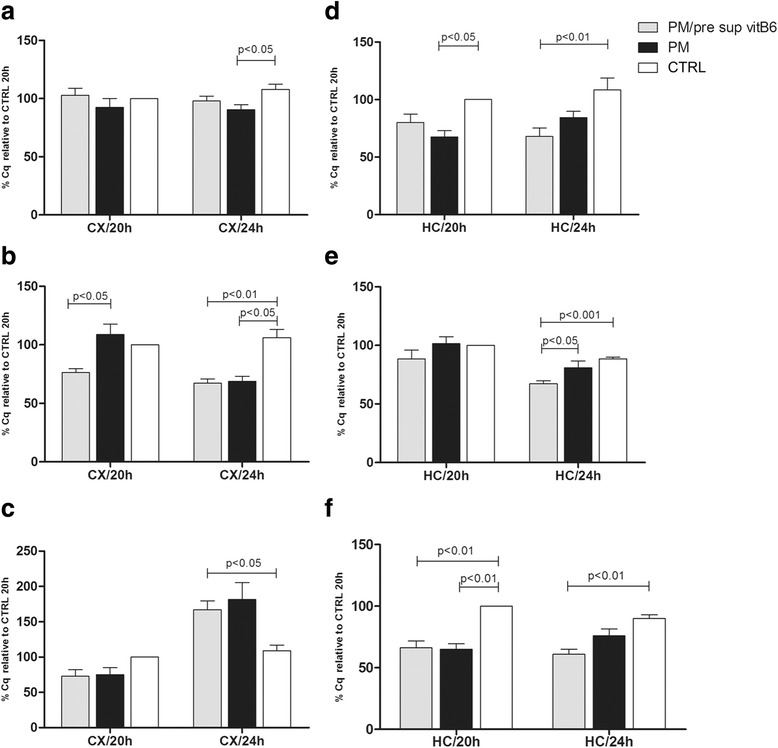
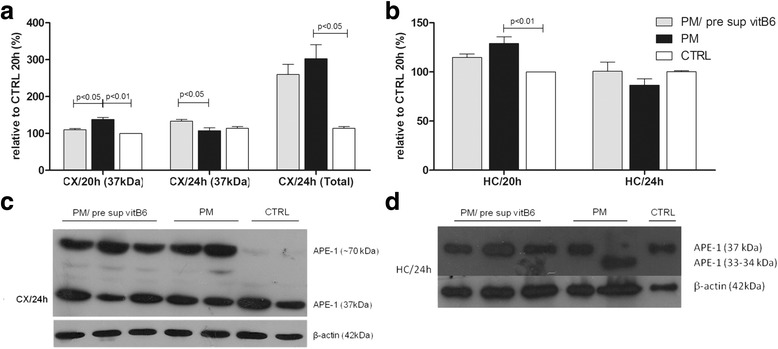
Background: The production of reactive oxygen species (ROS) during pneumococcal meningitis (PM) leads to severe DNA damage in the neurons and is the major cause of cell death during infection. Hence, the use of antioxidants as adjuvant therapy has been investigated. Previous studies have demonstrated the possible participation of apurinic/apyrimidinic endonuclease (APE1) during PM. The aims of this study were to investigate the APE1 expression in the cortical and hippocampal tissues of infant Wistar rats infected with Streptococcus pneumoniae and its association with cell death and understand the role of vitamin B6 (vitB6) as a protective factor against cell death.
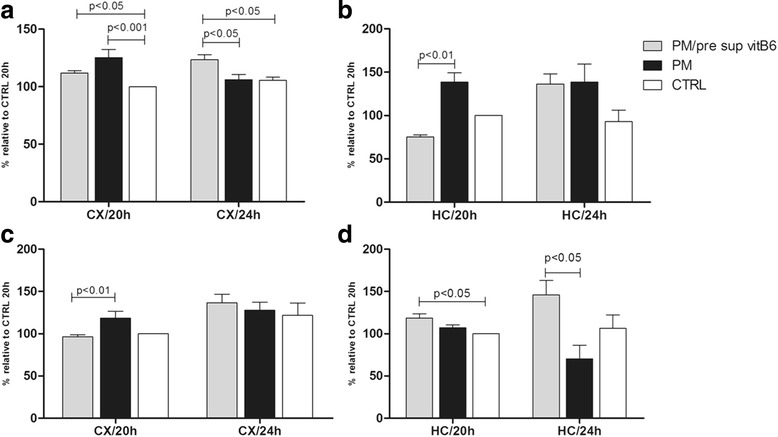
Methods: APE1 expression and oxidative stress markers were analyzed at two-time points, 20 and 24 h post infection (p.i.), in the cortex (CX) and hippocampus (HC) of rats supplemented with vitB6. Statistical analyses were performed by the nonparametric Kruskal-Wallis test using Dunn's post test.
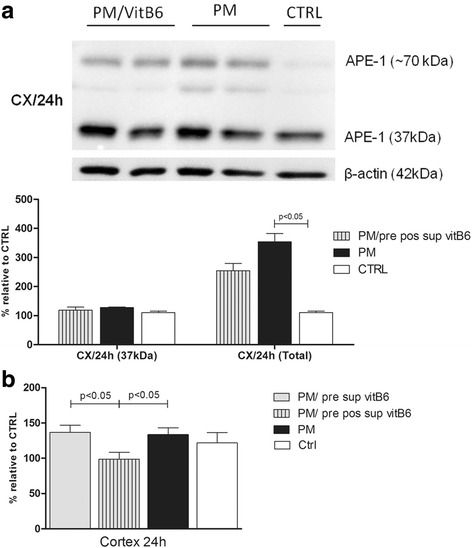
Results: Our results showed high protein levels of APE1 in CX and HC of infected rats. In the CX, at 20 h p.i., vitB6 supplementation led to the reduction of expression of APE1 and apoptosis-inducing factor, while no significant changes in the transcript levels of caspase-3 were observed. Furthermore, levels of carbonyl content and glutamate in the CX were reduced by vitB6 supplementation at the same time point of 20 h p.i.. Since our data showed a significant effect of vitB6 on the CX at 20 h p.i. rather than that at 24 h p.i., we evaluated the effect of administering a second dose of vitB6 at 18 h p.i. and sacrifice at 24 h p.i.. Reduction in the oxidative stress and APE1 levels were observed, although the latter was not significant. Although the levels of APE1 was not significantly changed in the HC with vitB6 adjuvant therapy, vitB6 supplementation prevented the formation of the truncated form of APE1 (34 kDa) that is associated with apoptosis.
Conclusions: Our data suggest that PM affects APE1 expression, which can be modulated by vitB6. Additionally, vitB6 contributes to the reduction of glutamate and ROS levels. Besides the potential to reduce cell death and oxidative stress during neuroinflammation, vitB6 showed enhanced effect on the CX than on the HC during PM.
Keywords: APE1; Cortex; Hippocampus; Oxidative stress; Pneumococcal meningitis; Vitamin B6.
Conflict of interest statement
Ethics approval
Animal studies were approved by the Animal Care and Experimentation Committee of Canton of Bern, Switzerland, and followed the guidelines of National Institute of Health for performing animal experiments.
Competing interests
The authors declare that they have no competing interests.
Publisher’s Note
Springer Nature remains neutral with regard to jurisdictional claims in published maps and institutional affiliations.
Figures
Similar articles
-
The cerebral protective effect and mechanism of action of vitamin B6 adjuvant ceftriaxone in experimental pneumococcal meningitis.Brain Res. 2018 Sep 15;1695:53-64. doi: 10.1016/j.brainres.2018.05.031. Epub 2018 May 22. Brain Res. 2018. PMID: 29800553
-
APE1 modulates cellular responses to organophosphate pesticide-induced oxidative damage in non-small cell lung carcinoma A549 cells.Mol Cell Biochem. 2018 Apr;441(1-2):201-216. doi: 10.1007/s11010-017-3186-7. Epub 2017 Sep 8. Mol Cell Biochem. 2018. PMID: 28887667
-
Nuclear complex of glyceraldehyde-3-phosphate dehydrogenase and DNA repair enzyme apurinic/apyrimidinic endonuclease I protect smooth muscle cells against oxidant-induced cell death.FASEB J. 2017 Jul;31(7):3179-3192. doi: 10.1096/fj.201601082R. Epub 2017 Apr 12. FASEB J. 2017. PMID: 28404743 Free PMC article.
-
The DNA base excision repair protein Ape1/Ref-1 as a therapeutic and chemopreventive target.Mol Aspects Med. 2007 Jun-Aug;28(3-4):375-95. doi: 10.1016/j.mam.2007.04.005. Epub 2007 May 3. Mol Aspects Med. 2007. PMID: 17560642 Review.
-
A review on protein-protein interaction network of APE1/Ref-1 and its associated biological functions.Cell Biochem Funct. 2015 Apr;33(3):101-12. doi: 10.1002/cbf.3100. Epub 2015 Mar 19. Cell Biochem Funct. 2015. PMID: 25790058 Review.
Cited by
-
Zymolytic Grain Extract (ZGE) Significantly Extends the Lifespan and Enhances the Environmental Stress Resistance of Caenorhabditis elegans.Int J Mol Sci. 2019 Jul 16;20(14):3489. doi: 10.3390/ijms20143489. Int J Mol Sci. 2019. PMID: 31315221 Free PMC article.
-
sRNA OsiA Stabilizes Catalase mRNA during Oxidative Stress Response of Deincoccus radiodurans R1.Microorganisms. 2019 Oct 8;7(10):422. doi: 10.3390/microorganisms7100422. Microorganisms. 2019. PMID: 31597319 Free PMC article.
-
APE1/Ref-1 Role in Inflammation and Immune Response.Front Immunol. 2022 Feb 28;13:793096. doi: 10.3389/fimmu.2022.793096. eCollection 2022. Front Immunol. 2022. PMID: 35296074 Free PMC article. Review.
-
A Dual Face of APE1 in the Maintenance of Genetic Stability in Monocytes: An Overview of the Current Status and Future Perspectives.Genes (Basel). 2020 Jun 11;11(6):643. doi: 10.3390/genes11060643. Genes (Basel). 2020. PMID: 32545201 Free PMC article. Review.
References
MeSH terms
Substances
LinkOut - more resources
Full Text Sources
Other Literature Sources
Medical
Research Materials
Miscellaneous
