. 2017 Dec 12;10(1):60.
doi: 10.1186/s13041-017-0339-2.

Immature morphological properties in subcellular-scale structures in the dentate gyrus of Schnurri-2 knockout mice: a model for schizophrenia and intellectual disability

Affiliations

Immature morphological properties in subcellular-scale structures in the dentate gyrus of Schnurri-2 knockout mice: a model for schizophrenia and intellectual disability

Akito Nakao et al. Mol Brain. .

Abstract

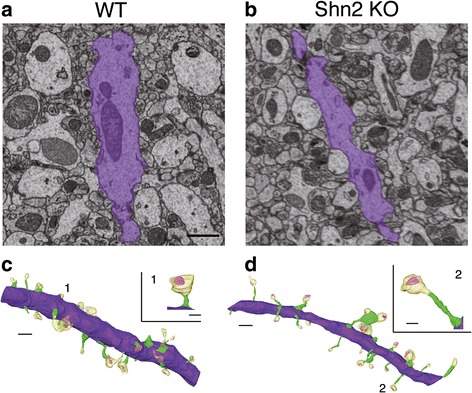
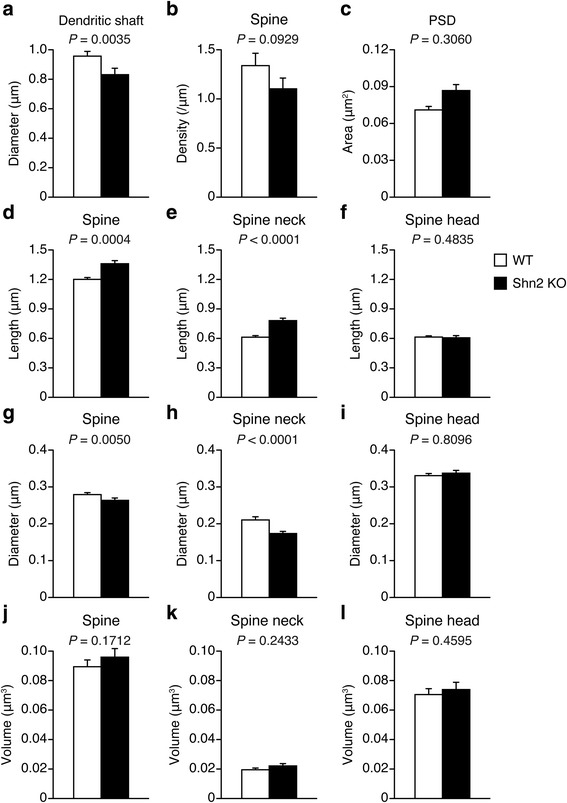
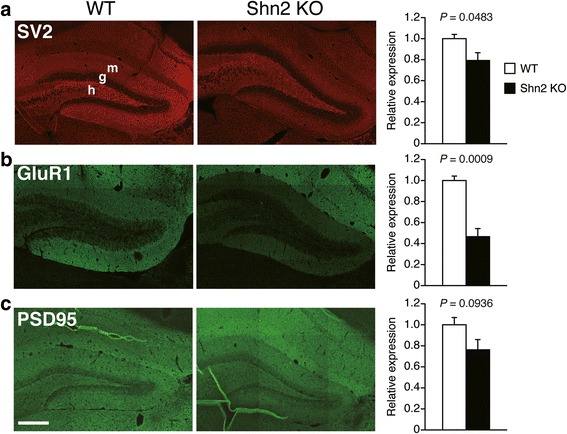
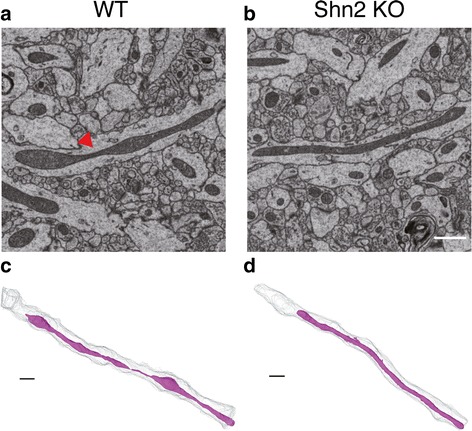
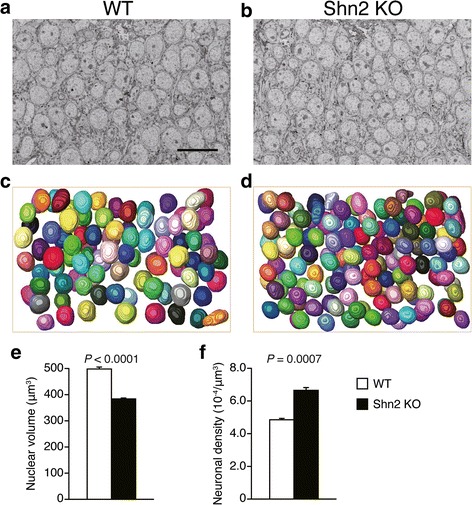
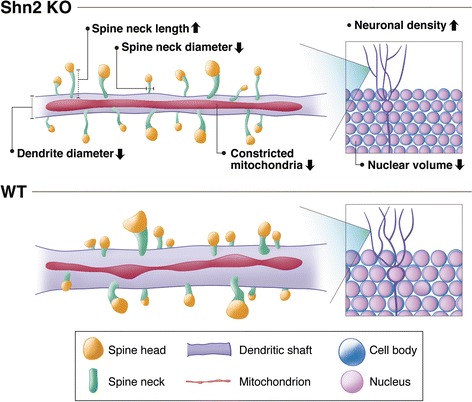
Accumulating evidence suggests that subcellular-scale structures such as dendritic spine and mitochondria may be involved in the pathogenesis/pathophysiology of schizophrenia and intellectual disability. Previously, we proposed mice lacking Schnurri-2 (Shn2; also called major histocompatibility complex [MHC]-binding protein 2 [MBP-2], or human immunodeficiency virus type I enhancer binding protein 2 [HIVEP2]) as a schizophrenia and intellectual disability model with mild chronic inflammation. In the mutants' brains, there are increases in C4b and C1q genes, which are considered to mediate synapse elimination during postnatal development. However, morphological properties of subcellular-scale structures such as dendritic spine in Shn2 knockout (KO) mice remain unknown. In this study, we conducted three-dimensional morphological analyses in subcellular-scale structures in dentate gyrus granule cells of Shn2 KO mice by serial block-face scanning electron microscopy. Shn2 KO mice showed immature dendritic spine morphology characterized by increases in spine length and decreases in spine diameter. There was a non-significant tendency toward decrease in spine density of Shn2 KO mice over wild-type mice, and spine volume was indistinguishable between genotypes. Shn2 KO mice exhibited a significant reduction in GluR1 expression and a nominally significant decrease in SV2 expression, while PSD95 expression had a non-significant tendency to decrease in Shn2 KO mice. There were significant decreases in dendrite diameter, nuclear volume, and the number of constricted mitochondria in the mutants. Additionally, neuronal density was elevated in Shn2 KO mice. These results suggest that Shn2 KO mice serve as a unique tool for investigating morphological abnormalities of subcellular-scale structures in schizophrenia, intellectual disability, and its related disorders.

Keywords: 3D electron microscopy; Intellectual disability; Mouse model; Schizophrenia.


Conflict of interest statement

Ethics approval

All procedures were approved by the Institutional Animal Care and Use Committee of Fujita Health University.

Consent for publication

Not applicable.

Competing interests

TM received research grants from Astellas Pharma Inc. and Toyama Chemical Co., Ltd. Other authors have no conflict of interests to declare.

Publisher’s Note

Springer Nature remains neutral with regard to jurisdictional claims in published maps and institutional affiliations.

Figures

Fig. 1
Fig. 1
Three-dimensional reconstruction of dendrites in the DG of Shn2 KO mice. (a, b) SEM images obtained through SBF-SEM in WT (a) and Shn2 KO (b) mice. Purple shows a dendritic shaft. (c, d) Three-dimensional reconstructions of representative dendrites in WT (a) and Shn2 KO (b) mice. Scale bars: 1 μm. Representative spines are in insets. Numbers indicate the position of spines. Scale bars: 0.3 μm. Purple, green, yellow and pink illustrate the dendritic shaft, spine neck, spine head, and PSD, respectively
Fig. 2
Fig. 2
Immature dendritic spine morphology in the DG in Shn2 KO mice. (a, b) Comparison of dendrite diameter (a) and spine density (b) in WT (n = 24 dendrites, 8 dendrites per each of 3 mice) and Shn2 KO mice (n = 24 dendrites, 8 dendrites per each of 3 mice). (cl) Mean values of PSD area (c), spine length (d), spine neck length (e), spine head length (f), spine diameter (g), spine neck diameter (h), spine head diameter (i), spine volume (j), spine neck volume (k), and spine head volume (l) in WT (n = 547 spines from 24 dendrites, 8 dendrites per each of 3 mice) and Shn2 KO mice (n = 386 spines from 24 dendrites, 8 dendrites per each of 3 mice). The P-values were calculated using a Wilcoxon rank sum test
Fig. 3
Fig. 3
Decreased expression of GluR1 and a nominally significant decrease in SV2 expression in the middle molecular layer of the DG of Shn2 KO mice. (ac) Representative images of SV2 (a), GluR1 (b), and PSD95 (c) staining in the DG of WT and Shn2 KO mice. Bar graphs represent fluorescence intensity normalized to that in the middle molecular layer in the DG of WT mice, and are presented as the mean ± SEM. For WT, n = 4 mice; for Shn2 KO, n = 4 mice. The P-values were calculated using Student’s t-test. Scale bar, 300 μm; g, granule cell layer; h, hilus; m, molecular layer
Fig. 4
Fig. 4
Abnormal mitochondrial morphology in Shn2 KO mice. (a, b) SEM images of mitochondria in WT (a) and Shn2 KO (b) mice. Red triangle indicates constriction in a mitochondrion. Scale bars, 1 μm. (c, d) Three-dimensional reconstruction of representative constricted mitochondrion in WT (c) and elongated mitochondrion in Shn2 KO (d) mice. Magenta shows a mitochondrion. Grey indicates dendritic shafts
Fig. 5
Fig. 5
Decreased nuclear volume and increased neuronal density in Shn2 KO mice. (a, b) SEM images of cell bodies of granule cells in WT (a) and Shn2 KO (b) mice. Scale bars, 20 μm (c, d) Three-dimensional reconstruction of nuclear in granule cells of WT (c) and Shn2 KO (d) mice. (e) Comparison of neuronal density in WT (n = 3) and Shn2 KO (n = 3) mice. (f) Comparison of nuclear volume in WT (n = 120 from 3 mice) and Shn2 KO mice (n = 120 from 3 mice). The P-values were calculated using Student’s t-test (e) and Wilcoxon rank sum test (f)
Fig. 6
Fig. 6
Schematic of morphological properties of subcellular-scale structures in DG of Shn2 KO mice

References

    1. Bagni C, Greenough WT. From mRNP trafficking to spine dysmorphogenesis: the roots of fragile X syndrome. Nat Rev Neurosci. 2005;6:376–387. doi: 10.1038/nrn1667. - DOI - PubMed
    1. Iwamoto K, Bundo M, Kato T. Altered expression of mitochondria-related genes in postmortem brains of patients with bipolar disorder or schizophrenia, as revealed by large-scale DNA microarray analysis. Hum Mol Genet. 2005;14:241–253. doi: 10.1093/hmg/ddi022. - DOI - PubMed
    1. Penzes P, Cahill ME, Jones KA, VanLeeuwen J-E, Woolfrey KM. Dendritic spine pathology in neuropsychiatric disorders. Nat Neurosci. 2011;14:285–293. doi: 10.1038/nn.2741. - DOI - PMC - PubMed
    1. Prabakaran S, Swatton JE, Ryan MM, Huffaker SJ, Huang JT-J, Griffin JL, et al. Mitochondrial dysfunction in schizophrenia: evidence for compromised brain metabolism and oxidative stress. Mol Psychiatry. 2004;9:684–697. doi: 10.1038/sj.mp.4001511. - DOI - PubMed
    1. Harris KM, Kater SB. Dendritic spines: cellular specializations imparting both stability and flexibility to synaptic function. Annu Rev Neurosci. 1994;17:341–371. doi: 10.1146/annurev.ne.17.030194.002013. - DOI - PubMed

MeSH terms