. 2017 Dec 18;43(6):763-779.e4.
doi: 10.1016/j.devcel.2017.10.029. Epub 2017 Dec 7.

Molecular Anatomy of the Developing Human Retina

Affiliations

Molecular Anatomy of the Developing Human Retina

Akina Hoshino et al. Dev Cell. .

Abstract

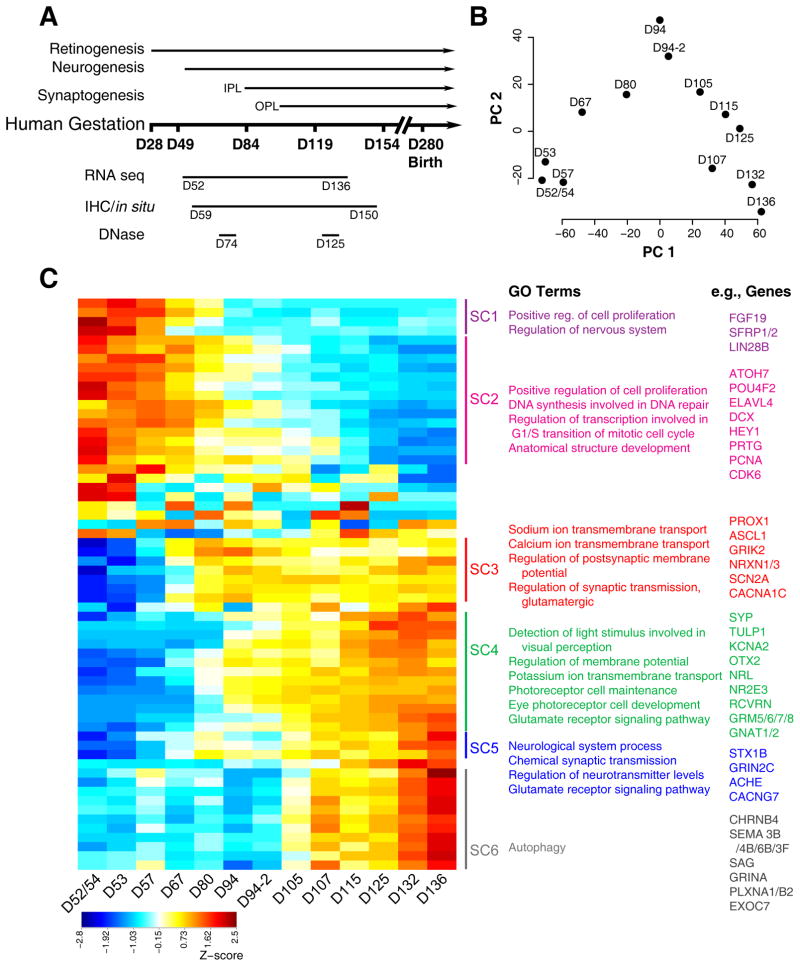
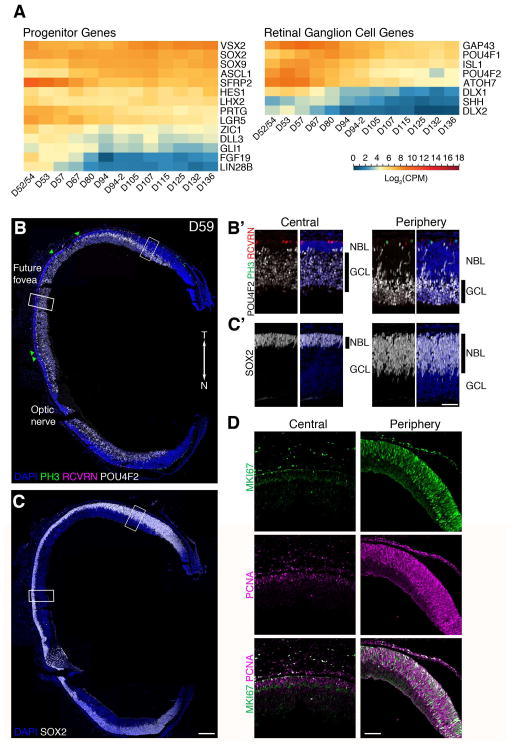
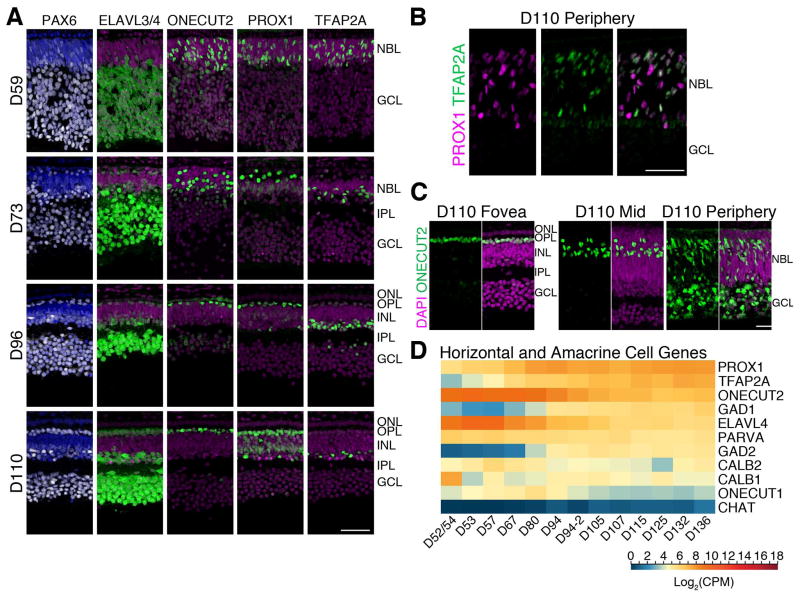
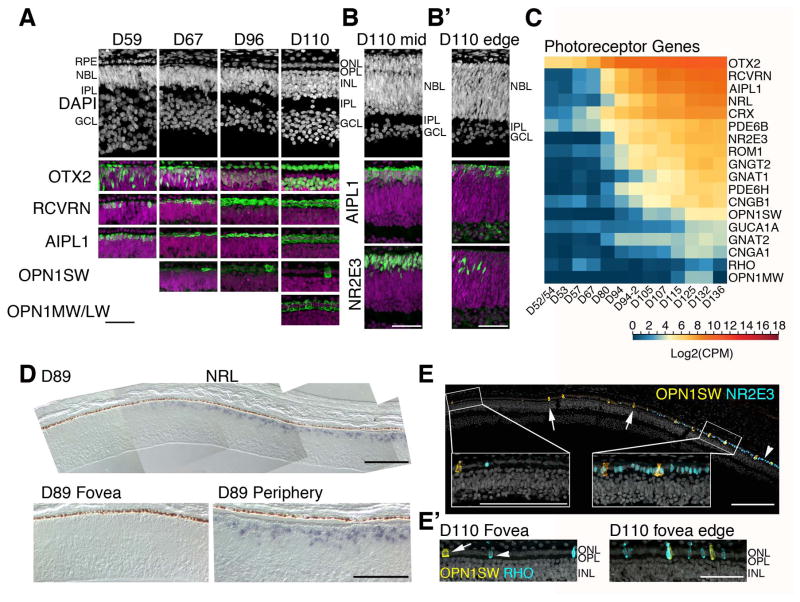
Clinical and genetic heterogeneity associated with retinal diseases makes stem-cell-based therapies an attractive strategy for personalized medicine. However, we have limited understanding of the timing of key events in the developing human retina, and in particular the factors critical for generating the unique architecture of the fovea and surrounding macula. Here we define three key epochs in the transcriptome dynamics of human retina from fetal day (D) 52 to 136. Coincident histological analyses confirmed the cellular basis of transcriptional changes and highlighted the dramatic acceleration of development in the fovea compared with peripheral retina. Human and mouse retinal transcriptomes show remarkable similarity in developmental stages, although morphogenesis was greatly expanded in humans. Integration of DNA accessibility data allowed us to reconstruct transcriptional networks controlling photoreceptor differentiation. Our studies provide insights into human retinal development and serve as a resource for molecular staging of human stem-cell-derived retinal organoids.

Keywords: development; fetal; fovea; gene network; human; macula; organoids; photoreceptor; retina; transcriptome.


Figures

Figure 1
Figure 1. Global analysis of RNA-seq data of human fetal retina ages D52–D136
A. Schematic of the experimental paradigm. The timing of developmental events was inferred using published studies of human fetal retina and birthdating studies of monkey retinae by shifting proportionately by length of gestation. Whole retinae were collected for RNA-seq (D52–D136; 17 samples) and DNase-seq (D74 and D125) studies. Whole eyes (D59–D150) were processed for immunohistochemistry and in situ hybridization. B. Principle component (PC) analysis indicated that the largest source of variation among the RNA-seq samples was age accounting for 59.3% of the variance in the data. Biological replicates for D94 were included in this study and were differentiated from each other with suffixes (e.g., D94-2). C. Z-score of the exemplar genes from the 62 clusters found by Affinity Propagation (AP) clustering analysis. Blue to red indicates a gradient from low to high gene expression. Six superclusters were obtained by cutting the dendrograms at a height 0.125 of 62 clusters. Pathway enrichment analysis was carried out for the genes in each supercluster. The top GO categories and examples of genes found in the cluster are given. See also Figures S1 and S4.
Figure 2
Figure 2. D59 human fetal retina is mainly composed of retinal ganglion cells and progenitors
A. Expression profile of select marker genes of retinal progenitors and ganglion cells. Genes were organized from high (red) to low (blue) based on its expression level at D136. B. PH3 (green, mitotic cells), RCVRN (Magenta, photoreceptors), and POU4F2 (white, ganglion cells), and C. SOX2 (white, progenitor cells). Green triangles point to PH3+ cells. Band C′. Higher magnification views of regions boxed in B and C. D. Immunostaining with MKI67 (green) and PCNA (magenta) show reduced proliferation in D59 central retina, however most cells in the NBL are positive for these makers in the periphery. Scale bars for B&C: 200 μm; B′, C′: 25 μm. T: Temporal; N: Nasal; NBL: Neuroblastic layer; GCL: Ganglion Cell Layer. See also Figure S2.
Figure 3
Figure 3. Horizontal and amacrine cell development in the human fetal fovea
A. D59–D110 foveas were immunolabeled with PAX6 (white), ELAVL3/4 (green, horizontal cells, amacrine cells, ganglion cells), ONECUT2 (green, cones, horizontal cells, ganglion cells), PROX1 (green, horizontal cells, amacrine cells, and Müller glia), and TFAP2A (amacrine cells). At early stages the horizontal and amacrine cells are intermixed, but by D96, the cells had migrated to the appropriate layer. B. Peripheral retina at D110 showing the PROX1+ horizontal and TFAP2A+ amacrine cells have still not formed a distinct layer. C. ONECUT2 is expressed by different cells during development; ONECUT2 is initially expressed in ganglion cells, cones, and horizontal cells but is later restricted to horizontal and a subset of amacrine cells. This range of expression was observed in a single section of a D110 retina, from the fovea to the peripheral edge. D. Log2 transformed Counts Per Million (CPM) values of selected horizontal and amacrine-related gene expression from RNA-seq were plotted as a heatmap. Blue to red represents low to high gene expression. Scale bars: 50 μm. INL: Inner Nuclear Layer; IPL; Inner Plexiform Layer; ONL: Outer Nuclear Layer; OPL: Outer Plexiform Layer.
Figure 4
Figure 4. Photoreceptor development in the human fetal retina
A. Human fetal retinae from ages D59–D110 were stained with photoreceptor markers. Each of the photoreceptor markers are shown in green and nuclei were counterstained with DAPI (magenta). A single layer of photoreceptors was already present at D59, some of which were AIPL1+ and RCVRN+. The first OPN1SW+ cell was detected at D67 and OPN1MW/LW was detected at D110. Foveas older than D67 were generally defined as a zone free of S-Opsin and NR2E3 immunoreactivity. B. Retinal structure and AIPL1 and NR2E3 expression were compared between mid-temporal (B) and temporal peripheral edge (B) of a D110 retina. Nuclear layers were not separated yet and NR2E3 expression was just beginning at the retinal edge. C. Heatmap for RNA-seq analysis of pan photoreceptor, cone, and rod genes show a steady increase over time. Blue indicates low and red indicates high gene expression. D. In situ hybridization of NRL mRNA at D89. The composite image shows the NRL-free fovea; NRL expression rapidly increases from the foveal edge and reaches the periphery (bottom right panel). E. A composite image of D110 fovea and 450 μm perifovea towards temporal retina. Immunostaining with OPN1SW (yellow) and a rod-specific marker NR2E3 (blue) showed a sharp increase in rod generation adjacent to the fovea. E′. A subset of these rods expressed RHO (blue). Scale bars for A–C: 50 μm.
Figure 5
Figure 5. Later cell types are generated by D73 in the fovea and bipolar cell process stratification is observed by D96
A. Fovea from D67–110 retinae were immunostained with OTX2 (first row: white, photoreceptors, bipolars); VSX2 and OTX2 (green and magenta, respectively; bipolar cells); RCVRN (white, OFF bipolar cells); GNAO1 (white, ON bipolar cells); and CABP5 (white, cone bipolar cells). Arrow heads point to VSX2+OTX2+ double-labeled bipolar cells. GNAO1 was first observed at D96 and CABP5 at D110. B. Higher magnification of D96 and D110 fovea double-labeled with GNAO1 and RCVRN show axonal arborizations in the IPL that were stratified into ON and OFF sublaminae by D96. C. Sections of D73–110 foveas were immunostained with SOX9 and RLBP1 (both green) revealed that a row of Müller glia was present in the fovea at D73 and RLBP1 expression got more elaborated over time. D. Log2 transformed Counts Per Million (CPM) values of select bipolar and Müller glia genes show a steady increase in gene expression beginning at D67–D80. Expression values plotted from high to low based on expression at D136. Blue to red indicates low to high gene expression. E. Immunostaining of the fovea of a D150 retina. In the IPL, SYP and PSD95 were expressed opposed to each other indicative of putative synapses. Scale bars: 50 μm. See also Figure S3.
Figure 6
Figure 6. RNA-seq of the macula, nasal central, and peripheral retina dissected at different time points of fetal development
A. Principle component (PC) analysis of these samples showed that the macula was developmentally ahead (further right on the PC1 ‘age’ axis) of the nasal central and peripheral regions of the same age. B. Z-score of the Affinity Propagation (AP) clustering exemplar genes from differential expression analysis of D59 central and D132 macula samples showed that genes that were upregulated were enriched for GO terms related to visual perception, while cell cycle-related genes were downregulated. C. A subset of progenitor and cell cycle genes were plotted to show that their downregulation over time occurs first in the macula. Heatmap of bipolar cell genes show that their gene expression of a late born cell type increases in the macula before the rest of the retina. D. There were some genes that were expressed highly in the macula and periphery, but not in the nasal retina (e.g., FOXG1), and others that were expressed higher in the nasal central and periphery but not in the macula (e.g., FOXD1). The differences in their Log2 Counts Per Million (CPM) values were calculated as the fold change and is plotted such that genes that are expressed more highly in nasal retina are on the left. E. In situ hybridization of ATOH7 in a D89 retina. ATOH7 mRNA expression can be seen in the NBL of the nasal central retina, whereas only a few ATOH7+ cells were observed in the fovea. Scale bar = 50 μm. See also Figures S5–8.
Figure 7
Figure 7. Comparison between developing mouse and human retina
A. Open-Ended Dynamic time warping analysis for comparison of embryonic (E) 11–Postnatal (P) 28 retinae with human D52–D136 retinae. There were 2661 differentially expressed genes in humans that had 1:1 mapping with mouse. Expression data of these genes were subjected to Open-Ended Dynamic Time Warping analysis and the results are plotted as a heatmap. B. Spearman correlation of 109 retinal genes reveal that early human retinae are similar to embryonic mouse retinae, but at later developmental times, the mouse and human retinae segregate. C. Pearson correlation of human and mouse genes. Approximately 38% of the genes were highly correlated between mouse and human (Pearson correlation coefficient ≥ 0.7), approximately 57% of the genes were semi/non-correlated (Pearson correlation coefficient > −0.7 and < 0.7), and approximately 5% of the genes were anti-correlated (Pearson correlation coefficient ≤ −0.7). Enriched GO terms for the correlated and semi/non-correlated are presented as well as several significantly expressed non-correlated genes. Heatmaps were generated using Z-scores of expressed genes and AP clustering.
Figure 8
Figure 8. DNase-seq shows changes in chromatin landscape between D74 and D125 retinae
Integrative analysis of RNA-seq and DNase-seq data yields putative regulators of NRL and CRX. A. The 1000 highest and lowest expressed genes show a strong correlation between DNase-seq signal at Transcription Start Site (TSS) of a gene and its expression at D74 (left panel) and D125 (right panel). B. To build the gene regulatory network, the promoter region of every gene (3 kb upstream and 100 bp downstream from the TSS) was scanned for Transcription Factor Binding site (TFBS) in conserved regions to obtain putative binding evidence, and the presence of potential binding was augmented with expression correlation to infer high confidence regulatory interactions (left panel). Scanning for putative regulators of 135 retina-expressed genes yielded a network with 219 nodes and 1237 edges (middle panel). The network inferred several known regulatory interactions between photoreceptor-specific transcription factors (right panel). C. Genome snapshot for NRL (left panel) and CRX (right panel) promoter regions that includes DNase-seq and RNA-seq tracks are shown, along with peak regions and conservation. We observed two distinct conserved domains (CDs) in NRL and one in CRX promoter region. D. Expression heatmaps of putative regulators of NRL (left and middle panel) and CRX (right panel). Only TFBS with >99% mean conservation confidence were plotted (middle panel).

Similar articles

Cited by

References

    1. Aldiri I, Xu B, Wang L, Chen X, Hiler D, Griffiths L, Valentine M, Shirinifard A, Thiagarajan S, Sablauer A, et al. The Dynamic Epigenetic Landscape of the Retina During Development, Reprogramming, and Tumorigenesis. Neuron. 2017;94:550–568. e510. - PMC - PubMed
    1. Bailey TL, Boden M, Buske FA, Frith M, Grant CE, Clementi L, Ren J, Li WW, Noble WS. MEME SUITE: tools for motif discovery and searching. Nucleic Acids Res. 2009;37:W202–208. - PMC - PubMed
    1. Bolger AM, Lohse M, Usadel B. Trimmomatic: a flexible trimmer for Illumina sequence data. Bioinformatics. 2014;30:2114–2120. - PMC - PubMed
    1. Bumsted O’Brien KM, Cheng H, Jiang Y, Schulte D, Swaroop A, Hendrickson AE. Expression of photoreceptor-specific nuclear receptor NR2E3 in rod photoreceptors of fetal human retina. Investigative ophthalmology & visual science. 2004;45:2807–2812. - PubMed
    1. Cayouette M, Poggi L, Harris WA. Lineage in the vertebrate retina. Trends Neurosci. 2006;29:563–570. - PubMed

Publication types