. 2018 Jan 9;10(1):134-150.
doi: 10.1016/j.stemcr.2017.11.003. Epub 2017 Dec 7.

Generation of Adrenal Chromaffin-like Cells from Human Pluripotent Stem Cells

Affiliations

Generation of Adrenal Chromaffin-like Cells from Human Pluripotent Stem Cells

Kwaku Dad Abu-Bonsrah et al. Stem Cell Reports. .

Abstract

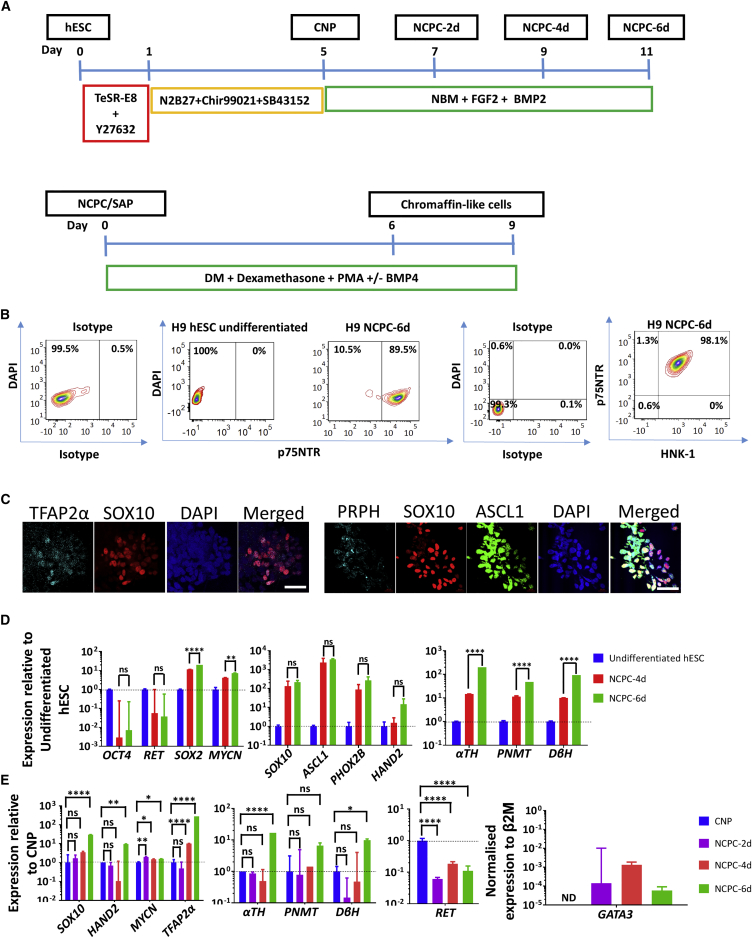
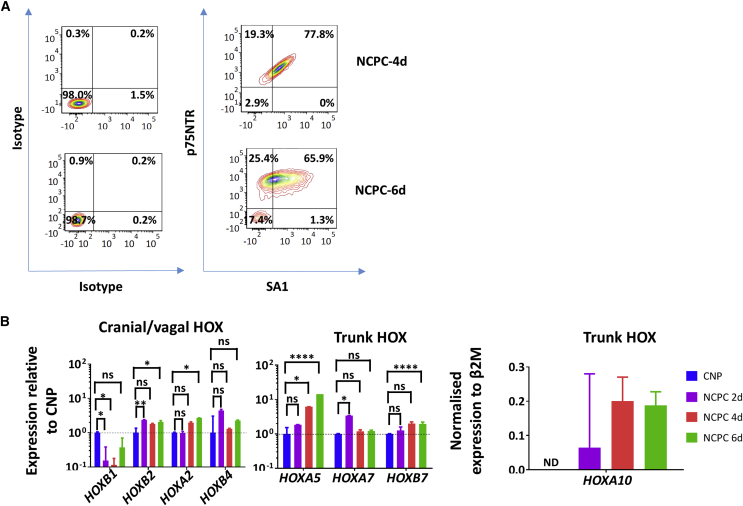
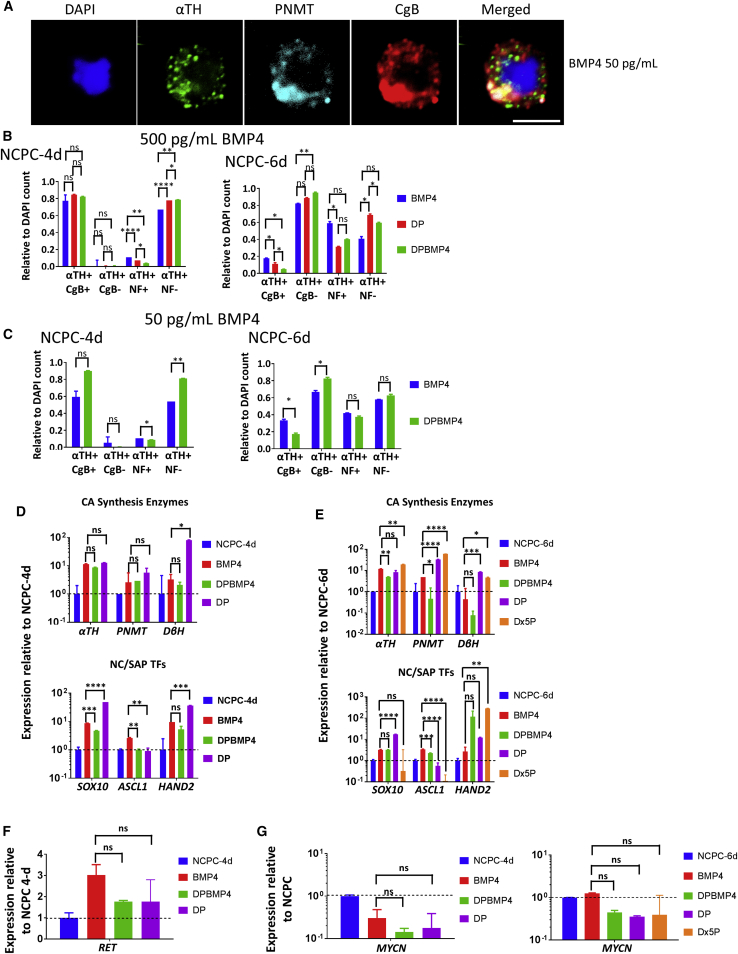
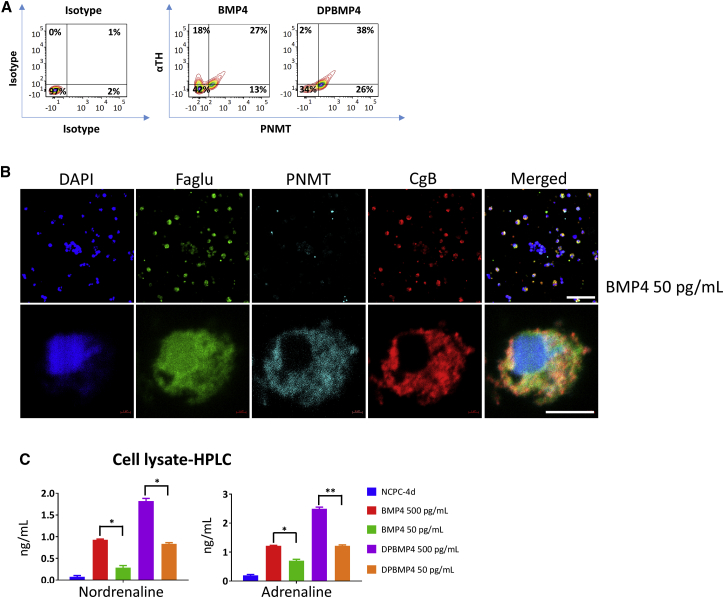
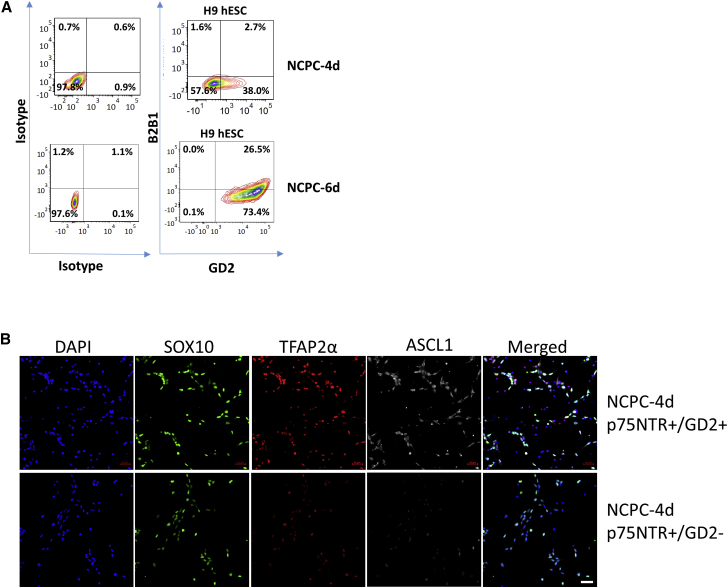
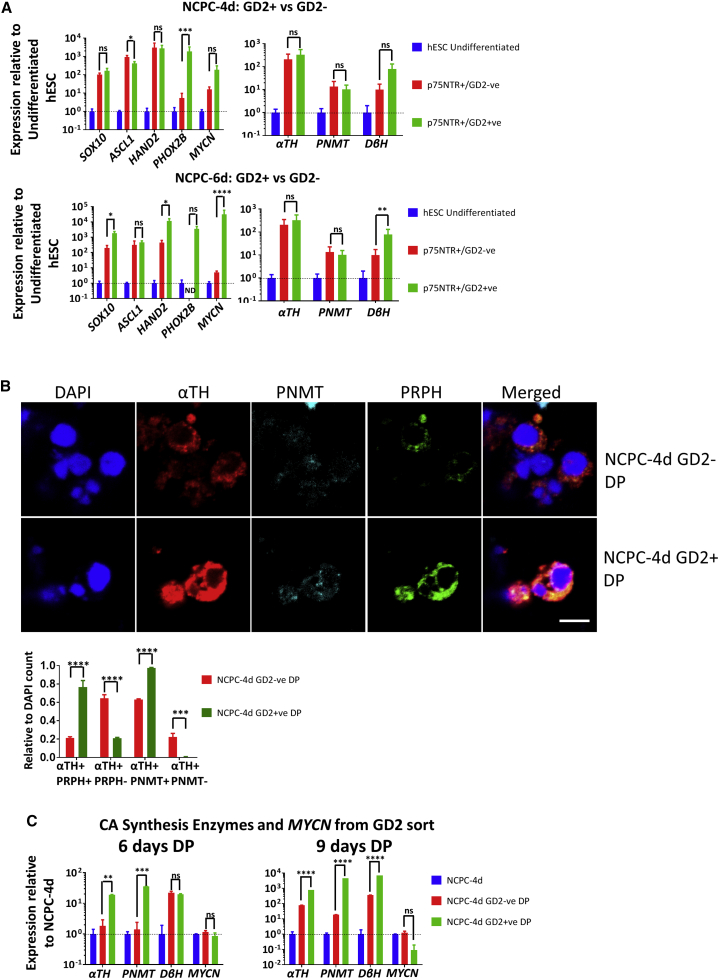
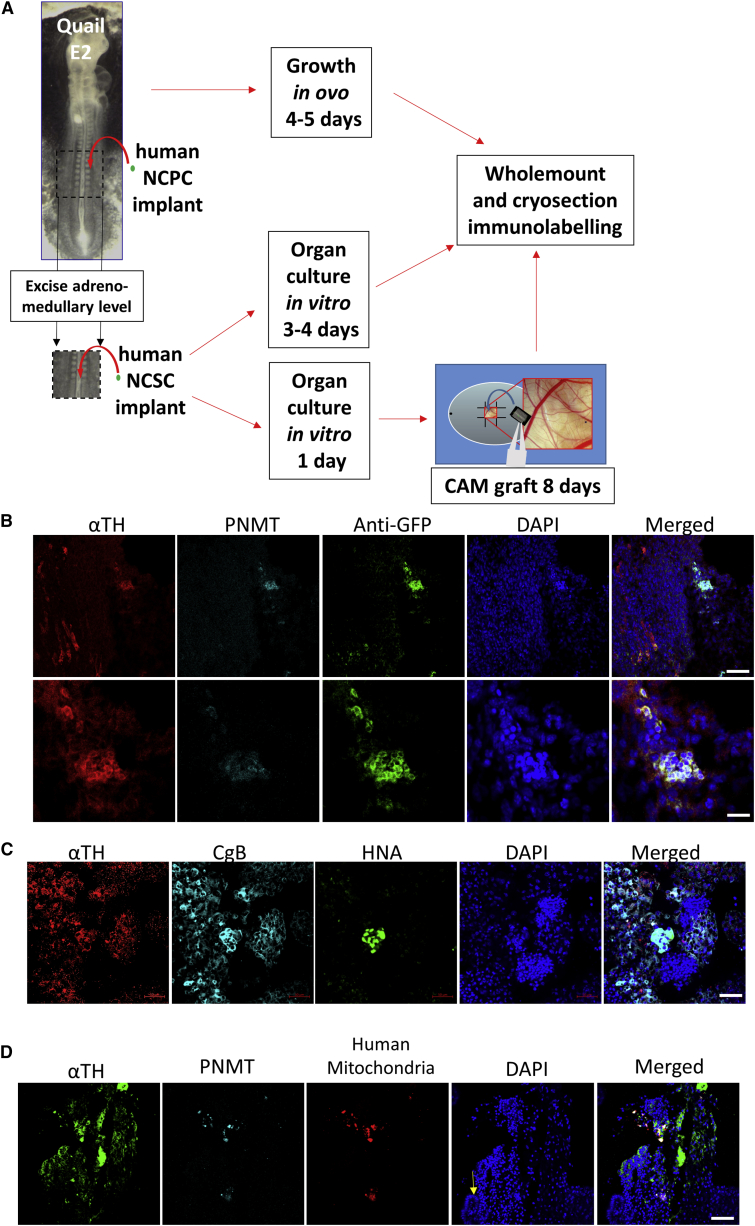
Adrenomedullary chromaffin cells are catecholamine (CA)-producing cells originating from trunk neural crest (NC) via sympathoadrenal progenitors (SAPs). We generated NC and SAPs from human embryonic stem cells (ESCs) and induced pluripotent stem cells (iPSCs) in vitro via BMP2/FGF2 exposure, ascertained by qPCR and immunoexpression of SOX10, ASCL1, TFAP2α, and PHOX2B, and by fluorescence-activated cell sorting selection for p75NTR and GD2, and confirmed their trunk-like HOX gene expression. We showed that continuing BMP4 and curtailing FGF2 in vitro, augmented with corticosteroid mimetic, induced these cells to upregulate the chromaffin cell-specific marker PNMT and other CA synthesis and storage markers, and we demonstrated noradrenaline and adrenaline by Faglu and high-performance liquid chromatography. We showed these human cells' SAP-like property of migration and differentiation into cells expressing chromaffin cell markers by implanting them into avian embryos in vivo and in chorio-allantoic membrane grafts. These cells have the potential for investigating differentiation of human chromaffin cells and for modeling diseases involving this cell type.

Keywords: chromaffin cells; human embryonic stem cells; human induced pluripotent cells; neural crest; sympathoadrenal progenitors.


Figures

Figure 1
Figure 1
Characterization of Human NCPCs/SAPs (A) Differentiation protocol of hESCs to NCPC/SAP-like cells and further to chromaffin-like cells. For details, refer to Figure S1. (B) FACS analysis of NCPC-6d showing co-expression of the NCPC markers p75NTR and HNK1. Representative of ten independent inductions of H9 cells. Non-specific antibody binding is shown as antibody isotype control. (C) Immunofluorescence of NCPC-6d cells with the NCPC/SAP markers SOX10, TFAP2α, ASCL1, and PRPH. Note the co-expression of early NC markers TFAP2 and SOX10 and a trend for markers of lineage progression, ASCL1 and PRPH, to segregate from early NC marker SOX10. Scale bars, 50 μm. (D) qPCR analysis of NCPC-4d and NCPC-6d normalized to undifferentiated hESC, showing upregulation of diverse NC/SAP markers. (E) Time point qPCR analysis NCPC-2d, NCPC-4d, and NCPC-6d normalized to CNP showing NC/SAP markers appear progressively. β2M, β2-microglobullin (housekeeping gene). N ≥ 3 independent experiments. Error bars represent mean ± SEM. ns, not significant, p > 0.05, ∗∗p > 0.01, ∗∗∗∗p > 0.0001.
Figure 2
Figure 2
Human NCPCs Express SA Markers and Possess the Positional Identity of Trunk NC Cells (A) FACS analysis of differentiation of H9 NCPC-4d and NCPC-6d (both representative of ten separations) with heightened expression of NCPC marker p75NTR and SAP marker SA1. (B) qPCR HOX gene analysis of CNP, NCPC-2d, NCPC-4d, and NCPC-6d. CNP (cranial positional identity, low-number HOX) was used to normalize the expression except for HOXA10, which was normalized to β2M. NCPC/SAP induction is accompanied by decreased expression of lowest-number and increased expression of higher-number HOX paralogs. ND, not detectable, pooled from N = 4 different inductions each, PCRs in triplicate. Error bars represent mean ± SEM. ns, not significant, p > 0.05, ∗∗p > 0.01, ∗∗∗∗p > 0.0001.
Figure 3
Figure 3
Human NCPCs/SAPs Differentiate into Chromaffin-like Cells In Vitro (A) Immunofluorescence of H9 NCPCs/SAPs differentiated with BMP4, showing co-expression of SAP marker, αTH, chromaffin marker, PNMT, and storage vesicle marker, CgB. Scale bar, 5 μm. (B and C) Immunofluorescence count of differentiation of NCPC-4d and NCPC-6d cells with 6 days high or low BMP4 stained for αTH, NF-200kDa, and CgB (see Figures 1A and S1B). Longer initial FGF2/BMP2 exposure resulted in a higher proportion of neuronal (NF+) and a lower proportion of CgB+ SAP cells. DAPI stain was used to assess the total number of cells. N = 8 independent experiments. (D and E) qPCR analysis of NCPC-4d and NCPC-6d cells differentiated with BMP4 and/or DP for 6 days. BMP-4 and corticosteroids increase chromaffin marker PNMT as well as SA markers. N = 4 independent experiments. (F and G) qPCR analysis of neuronal markers RET and MYCN of NCPC-4d and NCPC-6d cells with BMP4 and/or DP for 6 days. Inclusion of corticosteroids associated with lower neuronal marker expression. N = 4 independent experiments. Error bars represent mean ± SEM. ns, not significant, p > 0.05, ∗∗p > 0.01, ∗∗∗p > 0.001, ∗∗∗∗p > 0.0001.
Figure 4
Figure 4
Chromaffin-like Cells Differentiated from NCPCs/SAPs Produce CAs (A) Representative FACS plot of NCPCs differentiated to chromaffin-like cells as analyzed using αTH and PNMT antibodies. The plot suggests emergence of αTH+/PNMT− and αTH+/PNMT+ sub-populations in BMP4-only conditions, while addition of DP reduces the PNMT sub-population. N = 8 independent experiments; error bars represent mean ± SEM. (B) Immunofluorescence of H9 NCPC-4d cells differentiated with BMP4 (50 pg/mL) for 9 days with the chromaffin markers, PNMT, CgB, and Faglu, markers of CA synthesis and storage. Scale bars, 200 and 5 μm. (C) HPLC analysis of CA content in lysates of NCPC-4d cells differentiated for 9 days with BMP4 (500 pg/mL), BMP4 (50 pg/mL), DPBMP4 (500 pg/mL), and DPBMP4 (50 pg/mL). BMP4 and corticosteroid mimetic have a stimulatory effect on CA levels. N = 3 independent experiments. Error bars represent mean ± SEM. p > 0.05, ∗∗p > 0.01.
Figure 5
Figure 5
Expression of GD2 and B2B1 in NCPC/SAP Lineages and GD2 Selection (A) FACS analysis of p75NTR+ H9 NCPC-4d and NCPC-6d cells with GD2 (SAP lineages) and B2B1 (neuroblast lineage) shows increase in SA and neuronal differentiation. Each representative of ten independent experiments. (B) Immunofluorescence of NCPC-4d cells sorted as p75NTR+/GD2+ and p75NTR+/GD2−, and labeled with NCPC markers SOX10 and TFAP2α, and SAP marker ASCL1, the latter being enriched by GD2 selection. Scale bar: 50 μm.
Figure 6
Figure 6
FACS for GD2 Enriches SAP-like Cells (A) qPCR analysis of SA genes in p75NTR+/GD2+, p75NTR+/GD2− H9 NCPC-4d, and NCPC-6d cells. Expressions were normalized to that of hESCs. ND, not detectable at <35 cycles. N = 3 (4d) and N = 3 (6d) independent experiments. (B) NCPC-4d p75NTR+/GD2+ and p75NTR+/GD2− cells after 6 days differentiation in DP express SA (αTH), chromaffin (PNMT), and neuronal (PRPH) markers. Scale bar, 5 μm. After DP differentiation, PNMT and PRPH are extensively co-expressed, and proportions of these cells are both increased in the GD2+ population, and all αTH+/GD2+ cells expressed PNMT. DAPI was used to count the total cells. N = 4 independent experiments. (C) qPCR analysis of NCPC-4d p75NTR+/GD2+ cells differentiated with DP for 6 and 9 days. GD2 preselection augments PNMT expression as well as other SAP genes. ND, not detectable, N = 4 independent experiments. Error bars represent mean ± SEM. ns, not significant, p > 0.05, ∗∗p > 0.01, ∗∗∗p > 0.001, ∗∗∗∗p > 0.0001.
Figure 7
Figure 7
NCPC/SAP-like Cells Migrate and Differentiate in Embryonic Tissues (A) Scheme of the transplantation of hESC-derived NCPCs in quail E2 embryos and incubated in vivo or cultured in vitro or grown on CAM. (B) Immunofluorescence with chromaffin markers, αTH and PNMT, of NCPCs derived from ENVY-HES3 hESCs transplanted for 4 days in QE2 embryo. This frontal-oblique section is further ventral to the section shown in Figure S7. The human αTH+ cells associate with similar lineage host cells. Scale bars, 50 μm (upper) and 10 μm (lower). (C) Immunofluorescence with SA markers, αTH and CgB, and human cell-recognizing antibody, anti-human nuclear antigen, of NCPCs derived from H9 hESCs transplanted into QE2 tissue and cultured in vitro for 4 days. Scale bar, 50 μm. (D) Immunofluorescence with chromaffin markers, αTH and PNMT, and anti-human mitochondria antibody of NCPCs derived from H9 hESCs transplanted into QE2 tissue and cultured on CAM for 8 days. Section is through the αTH-expressing tissue at the margin of mesonephric kidney tissue (arrow). Scale bar, 50 μm.

References

    1. Abu-Bonsrah K.D., Zhang D., Newgreen D.F. CRISPR/Cas9 targets chicken embryonic somatic cells in vitro and in vivo and generates phenotypic abnormalities. Sci. Rep. 2016;6:34524. - PMC - PubMed
    1. Allmendinger A., Stoeckel E., Saarma M., Unsicker K., Huber K. Development of adrenal chromaffin cells is largely normal in mice lacking the receptor tyrosine kinase c-Ret. Mech. Dev. 2003;120:299–304. - PubMed
    1. Anderson D.J. Molecular control of cell fate in the neural crest: the sympathoadrenal lineage. Annu. Rev. Neurosci. 1993;16:129–158. - PubMed
    1. Anderson D.J., Carnahan J.F., Michelsohn A., Patterson P.H. Antibody markers identify a common progenitor to sympathetic neurons and chromaffin cells in vivo and reveal the timing of commitment to neuronal differentiation in the sympathoadrenal lineage. J. Neurosci. 1991;11:3507–3519. - PMC - PubMed
    1. Attie-Bitach T., Abitbol M., Gerard M., Delezoide A.L., Auge J., Pelet A., Amiel J., Pachnis V., Munnich A., Lyonnet S. Expression of the RET proto-oncogene in human embryos. Am. J. Med. Genet. 1998;80:481–486. - PubMed

Publication types

MeSH terms

Substances