. 2018 Jan 9;10(1):196-211.
doi: 10.1016/j.stemcr.2017.11.002. Epub 2017 Dec 7.

Breast Cancers Activate Stromal Fibroblast-Induced Suppression of Progenitors in Adjacent Normal Tissue

Affiliations

Breast Cancers Activate Stromal Fibroblast-Induced Suppression of Progenitors in Adjacent Normal Tissue

Sumanta Chatterjee et al. Stem Cell Reports. .

Abstract

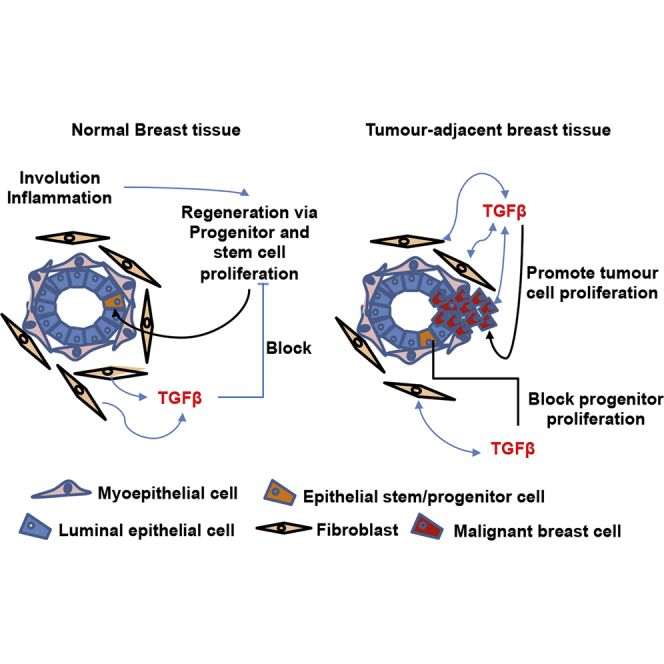
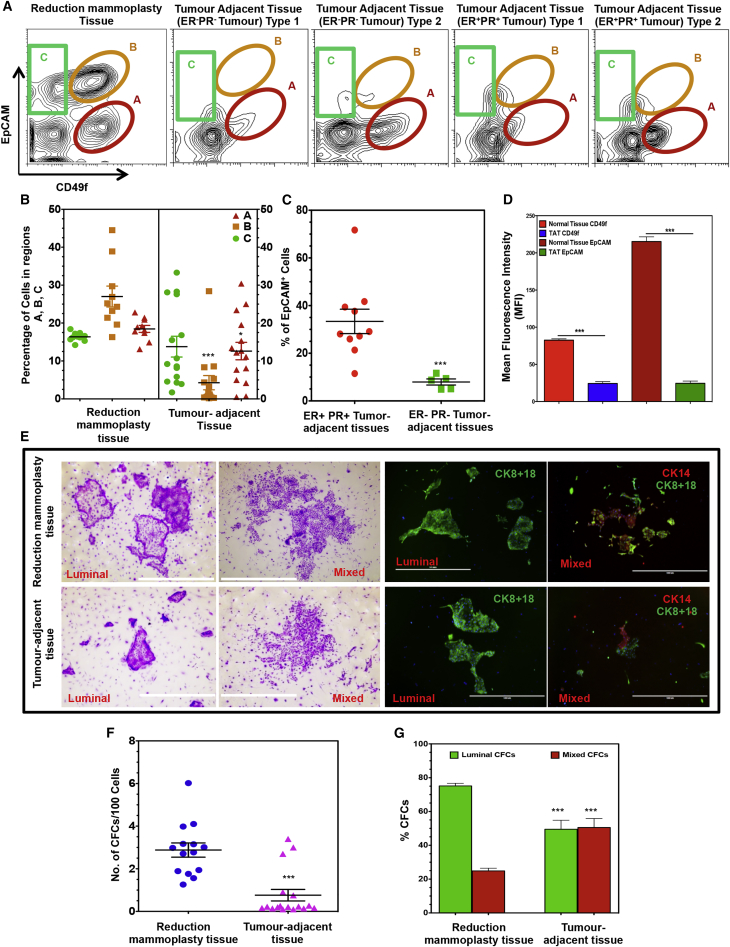
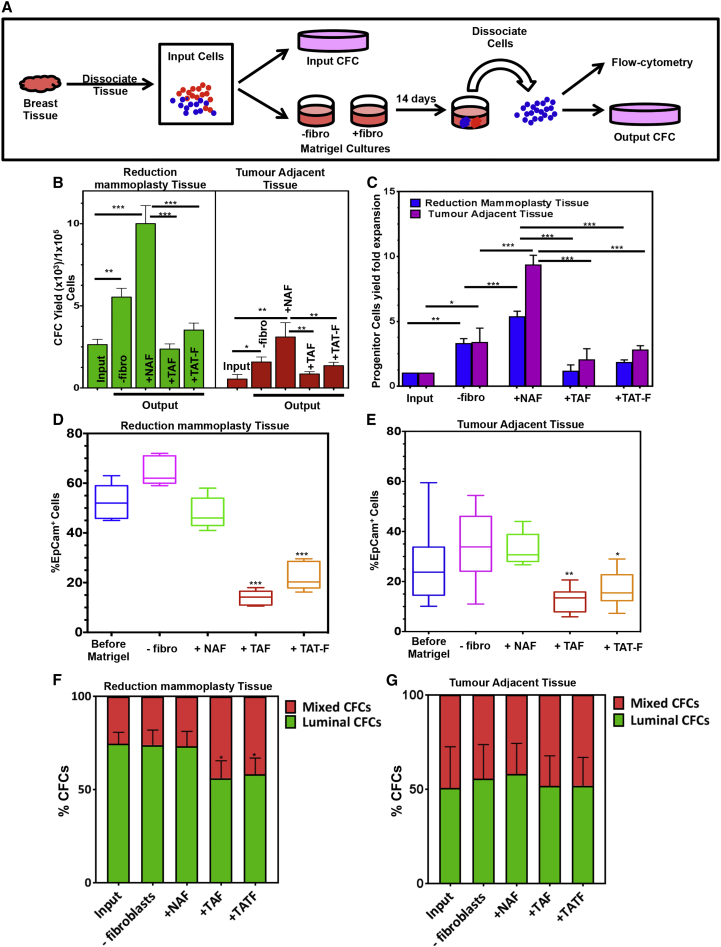
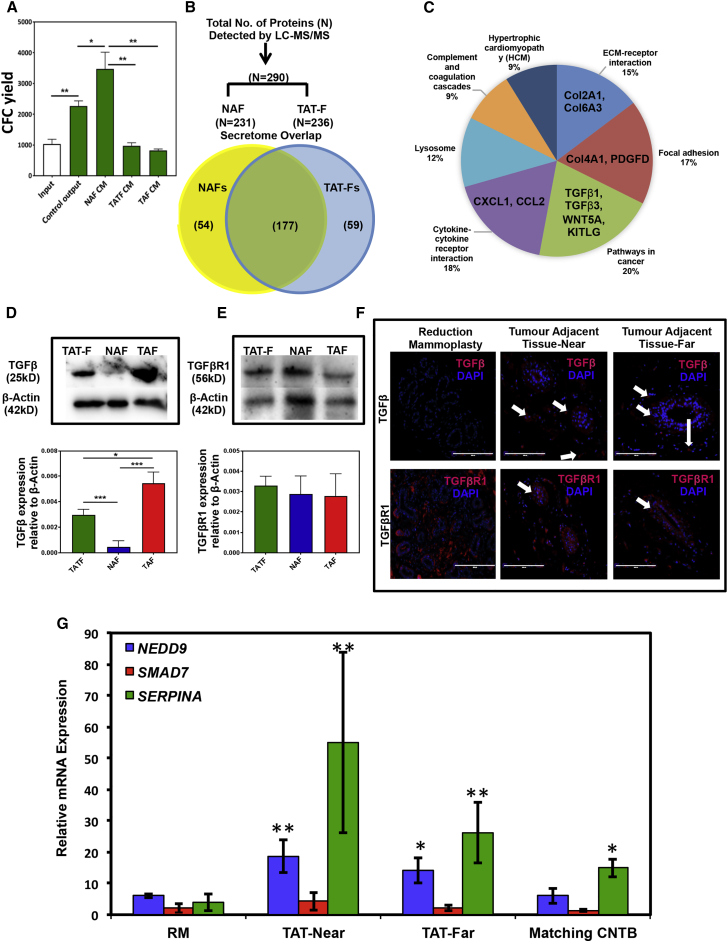
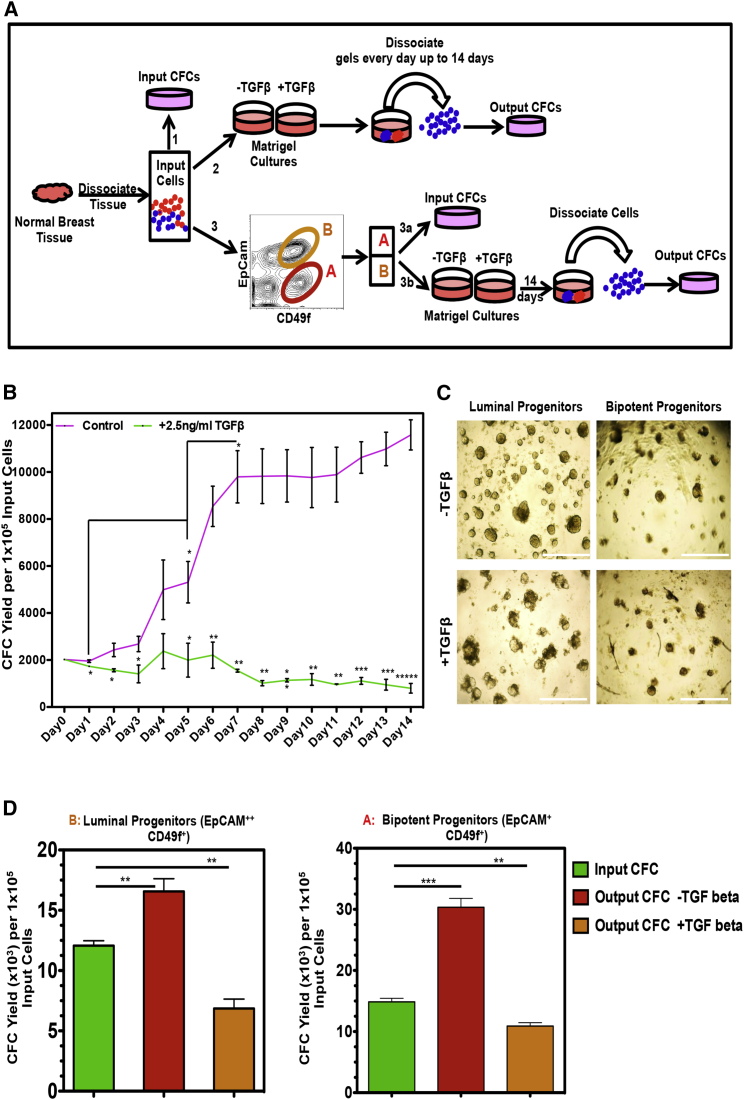
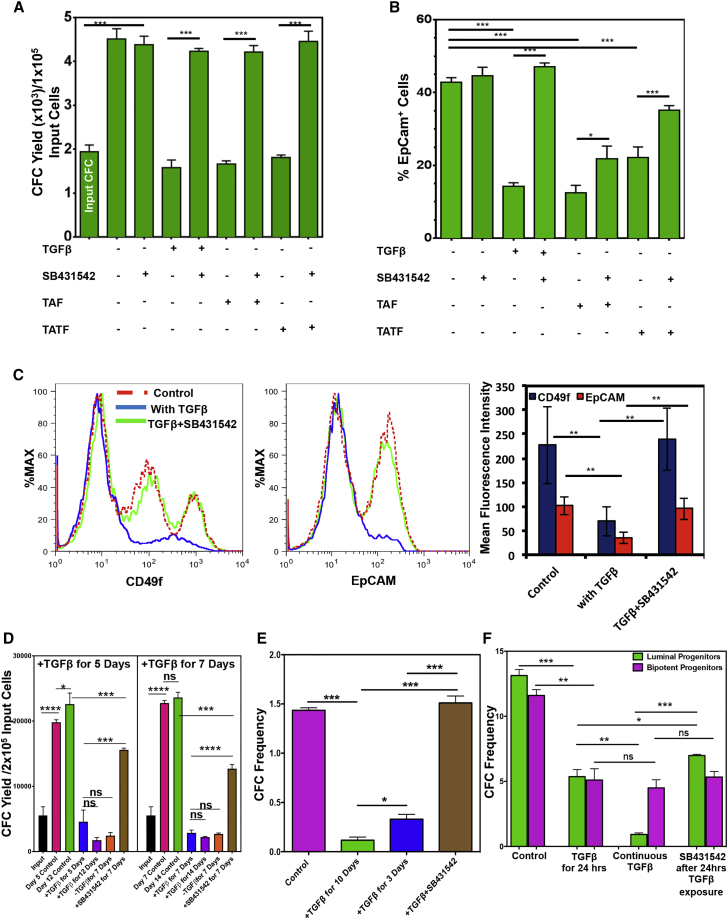
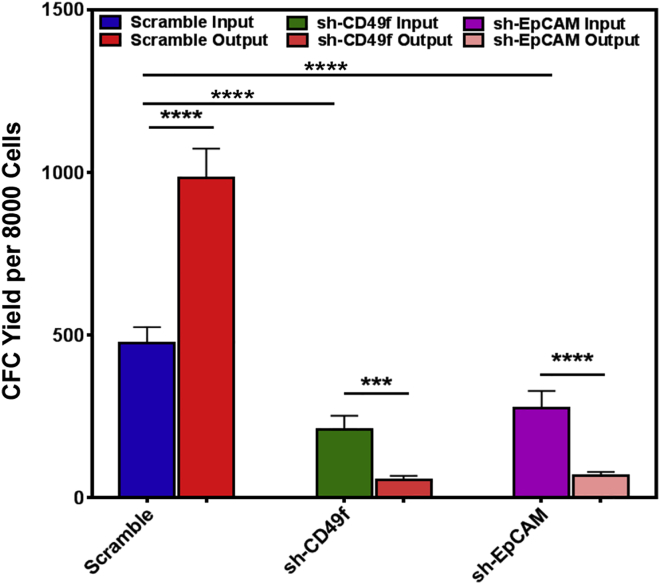
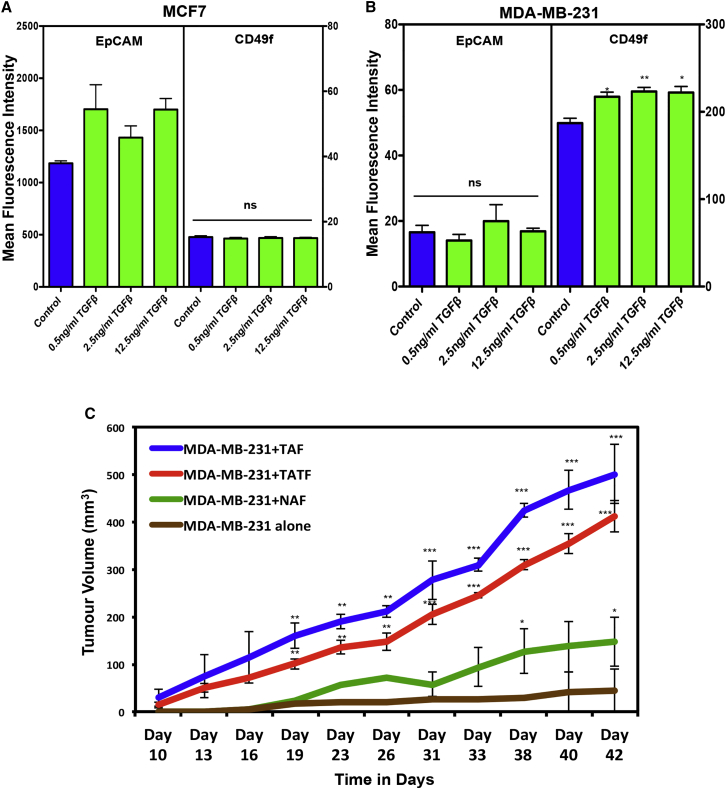
Human breast cancer cells are known to activate adjacent "normal-like" cells to enhance their own growth, but the cellular and molecular mechanisms involved are poorly understood. We now show by both phenotypic and functional measurements that normal human mammary progenitor cells are significantly under-represented in the mammary epithelium of patients' tumor-adjacent tissue (TAT). Interestingly, fibroblasts isolated from TAT samples showed a reduced ability to support normal EGF-stimulated mammary progenitor cell proliferation in vitro via their increased secretion of transforming growth factor β. In contrast, TAT fibroblasts promoted the proliferation of human breast cancer cells when these were co-transplanted in immunodeficient mice. The discovery of a common stromal cell-mediated mechanism that has opposing growth-suppressive and promoting effects on normal and malignant human breast cells and also extends well beyond currently examined surgical margins has important implications for disease recurrence and its prevention.

Keywords: TGF-β; activated stromal fibroblasts; breast cancer; suppression of normal breast tissue progenitors; tumor-adjacent tissue.


Figures

None
Graphical abstract
Figure 1
Figure 1
Decreased CD49f and EpCAM Expression and Progenitor Content of TAT Samples (A) Representative FACS plots showing population A, a bipotent progenitor-enriched EpCAMlowCD49fhigh fraction; population B, a luminal progenitor-enriched EpCAMhighCD49flow fraction; and population C, a CD49fEpCAMhigh fraction that lacks progenitor activity in the different types of tissues analyzed. TAT samples were divided into those where population A comprised either <15% or >15% of the Lin cells and are shown separately for patients whose tumors were ERPR or ER+PR+. (B) Comparison of the relative numbers of different populations shown in (A) obtained from 15 different TAT-far (patient nos. 1–15; Table S1) and 10 normal reduction mammoplasty samples were analyzed. Both populations A (p < 0.05) and B (p < 0.001) were reduced relative to their counterparts in normal breast tissue. Values shown are the mean ± SEM. (C) TAT samples from 5 ER tumors (patient nos. 1, 2, 3, 7, and 10; Table S1) contained a smaller proportion of EpCAM+ Lin cells (p < 0.001) compared with those next to 10 ER+ tumors (patient nos. 4–6, 8, 9, and 11–15; Table S1). Values shown are the means ± SEM. (D) Comparison of average mean fluorescent intensities (MFI) of CD49f and EpCAM in 10 normal and 15 different TAT samples (patient nos. 1–15; Table S1). Values shown are the means ± SEM. (E) Representative photographs of colonies obtained from freshly isolated CFCs from normal breast and TAT samples. Luminal colonies were identified based on their exclusive content of cytokeratin 8/18+ cells and mixed colonies based on their content of both cytokeratin 8/18+ and cytokeratin 14+ cells in the same colony. Scale bars represent 400 μm. (F) Comparison of the CFC frequencies in Lin cells obtained from 14 different normal breasts and 15 different TAT samples (patient nos. 1–15; Table S1). Values shown are the means ± SEM. (G) Comparison of the frequencies of the separate CFC subtypes in the Lin cells from 14 different normal breast tissue and 15 different TAT samples (patient nos. 1–15; Table S1) assessed in (F). Values shown were derived from counting stained colonies and are means ± SEM from 15 experiments (∗∗∗p < 0.0001).
Figure 2
Figure 2
TAT-Derived Fibroblasts Show a Decreased Ability to Support Progenitor Cell Expansion in Matrigel Cultures (A) Experimental design. (B) Effect of including fibroblasts from 5 different normal and 5 different TAT (patient nos. 3, 4, 6, 9, and 10; Table S1) breast tissues on CFC yields from 14-day Matrigel cultures initiated with normal breast (11 different samples) or TAT (10 different samples, patient nos. 2, 3, 4–9, 11, and 12) Lin cells. Values shown are the means ± SEM from experiments. (C–E) Same data as in (B) expressed as fold changes relative to the corresponding input values. Parallel comparison of FACS-determined frequencies of EpCAM+ cells obtained in cultures initiated with Lin normal (D) or Lin TAT (E) cells. Box and Whisker plots are used to show the median and the min to max range of the values. (F) Effect of different sources of fibroblasts, same as described in (B), on the relative yields of luminal and bipotent CFCs compared with the input ratio of these cells in cultures initiated with normal mammary cells. (G) Parallel data as in (F) but for cultures initiated with Lin TAT cells. Values shown are the means ± SEM. p < 0.05, ∗∗p < 0.005, ∗∗∗p < 0.0005.
Figure 3
Figure 3
TAT Fibroblasts Exhibit a TGF-β-Enriched Secretome Signature and Abnormal Presence of TGF-β in Histologically Normal TAT Samples (A) Effect of conditioned medium collected from 3 different normal and 3 different TAT-derived (patient nos. 3, 4, and 6; Table S1) fibroblasts on CFC yields from 14-day Matrigel cultures initiated with normal breast (3 different samples) Lin cells. Values shown are the means ± SEM from experiments. (B) Comparison of differentially expressed proteins in the secretome of fibroblasts derived from 3 different normal breast and 3 different TAT samples (patient nos. 3, 4, and 6; Table S1) determined by unbiased, high content comparison of mass spectrometric analysis (MS) of liquid chromatographically (LC) purified proteins in 48-hr conditioned medium. (C) Display of relative numbers of uniquely secreted proteins analyzed using the KEGG Pathway Database (Table S3). Western blot analysis of TGF-β (D) and TGF-βR1 (E) in fibroblasts obtained from 3 different TAT samples (patient nos. 3, 4, and 6; Table S1), 3 different normal breast tissues and 3 different TAT sample matched tumor tissues (patient nos. 3, 4, and 6; Table S1). The upper panels show representative blots and the lower panels show the average expression values obtained from analyses of 3 different fibroblast lines using Actin as the loading control. Values shown are the means ± SEM. (F) Representative histological sections prepared from normal breast and TAT samples stained with anti-TGF-β and anti-TGF-βR1 antibodies (in red) with DAPI used to visualize cell nuclei (blue color). Photomicrographs shown are representative of 3 experiments. Arrows in the pictures show the presence of TGF-β (upper panel) or TGF-βR1 (lower panel) in the tumour adjacent “near” or “far” tissue sections. Scale bars represent 200 μm. (G) Transcript levels of known TGF-β target genes (SERPIN-A, SMAD7, and NEDD9) determined by qPCR in the different tissue samples shown. Results are from 3 different normal and 3 matched TAT-near, TAT-far and contralateral non-tumor containing breast (CNTB) samples (patient nos. 4, 6, and 12; Table S1) after being normalized against GAPDH transcript levels. Values shown are the means ± SEM. p < 0.05, ∗∗p < 0.005, ∗∗∗p < 0.0005.
Figure 4
Figure 4
TGF-β Inhibits Normal Progenitor Cell Outputs In Vitro (A) Experimental design. (B) Time course analysis of changing CFC numbers in Matrigel cultures initiated with three different Lin reduction samples in the presence or absence of added TGF-β. Values shown are the means ± SEM from three experiments. (C) Representative photomicrographs of the structures seen in the Matrigel cultures initiated with FACS-purified luminal or bipotent progenitor-enriched fractions with or without TGF-β. Scale bars represent 1000 μm. (D) Comparison of the average input and 14-day yields of CFCs in the cultures initiated with three different normal FACS-purified luminal or bipotent progenitor-enriched fractions with or without TGF-β (p < 0.05, ∗∗p < 0.005, ∗∗∗p < 0.0005, ∗∗∗∗p < 0.00005). Values shown are the means ± SEM from three experiments.
Figure 5
Figure 5
TAT-Derived Fibroblasts Do Not Support the Generation of CFCs, and This Is Mediated by TGF-β-Induced SMAD4 Signaling in the Target Cells Matrigel cultures were initiated with Lin breast reduction cells and different sources of fibroblasts (3 different normal and 3 different TAT samples from patient nos. 3, 4, and 6; Table S1) and treated with the SMAD4 inhibitor (SB31542) or TGF-β ± SB431542 or vehicle controls. Some cells were used to obtain input CFCs. Matrigels were dissolved after 14 days, output CFCs were obtained, and average per each condition is depicted in a bar graph (A). Values shown are the means ± SEM from three experiments. (B) EpCAM+ cell frequency values for the same cultures analyzed in (A). (C) Representative FACS profiles of CD49f (left panel) and EpCAM (right panel) stained cells from the same cultures analyzed in (A). Mean ± SEM assessments of the MFIs of cells from three experiments are depicted in the lower panel. (D) Yields of CFCs in 14-day Matrigel cultures initiated with three different normal breast Lin cells that were subjected to TGF-β for varying initial periods followed by normal medium ± SB431542. Values shown are the means ± SEM from three experiments. (E) Effect of TGF-β added after 24 hr for 3 or 10 days on the CFC frequency of normal Lin cells. Values shown are the means ± SEM from three experiments. (F) Effect on colony formation by FACS-purified populations of luminal or bipotent CFC-enriched populations plated in 2D assays of the addition of TGF-β for 24 hr starting 24 hr after plating ± SB431542 for an additional 9 days. Some cultures were also exposed to TGF-β continuously. Values shown are the means ± SEM from three experiments (p < 0.05; ∗∗p < 0.005; ∗∗∗p < 0.0005; ∗∗∗∗p < 0.00005; ns, p > 0.05).
Figure 6
Figure 6
Forced Decreased Expression of CD49f or EpCAM Reduces Normal Progenitor Cell Detection and Generation In Vitro Effects of lentiviral-mediated decreased expression of CD49f and EpCAM (using lentiviral GFP vectors encoding specific sh-cDNAs) on colony formation by transduced (GFP+) normal Lin breast cells before and after 14 days of incubation in Matrigel cultures. Values shown are the mean ± SEM from three experiments (∗∗∗p < 0.001, ∗∗∗∗p < 0.00005).
Figure 7
Figure 7
Tumor-Adjacent Breast Tissue Fibroblasts Enhance Breast Cancer Tumor Growth (A and B) Effect of TGF-β on CD49f and EpCAM expression on MCF7 and MD-MB-231 cells assessed after 2 days of exposure in vitro. Values shown are the means ± SEM MFIs measured in three experiments (p < 0.05, ∗∗p < 0.005). (C) Effect of co-injected fibroblasts from different tissue sources (3 normal and 3 matched TAT and tumor samples from patient nos. 3, 4, and 6; Table S1) on the tumor growth rates of MDA-MB-231 cells transplanted subcutaneously into immunodeficient mice. Co-injected fibroblasts from tumors (TAFs) or TAT (TAT-Fs) significantly (∗∗p < 0.005; ∗∗∗p < 0.001) enhanced tumor growth compared with MD-MB-231 cells alone.

Similar articles

Cited by

References

    1. Allinen M., Beroukhim R., Cai L., Brennan C., Lahti-Domenici J., Huang H., Porter D., Hu M., Chin L., Richardson A. Molecular characterization of the tumor microenvironment in breast cancer. Cancer Cell. 2004;6:17–32. - PubMed
    1. Arvold N.D., Taghian A.G., Niemierko A., Abi Raad R.F., Sreedhara M., Nguyen P.L., Bellon J.R., Wong J.S., Smith B.L., Harris J.R. Age, breast cancer subtype approximation, and local recurrence after breast-conserving therapy. J. Clin. Oncol. 2011;29:3885–3891. - PMC - PubMed
    1. Banerji S., Cibulskis K., Rangel-Escareno C., Brown K.K., Carter S.L., Frederick A.M., Lawrence M.S., Sivachenko A.Y., Sougnez C., Zou L. Sequence analysis of mutations and translocations across breast cancer subtypes. Nature. 2012;486:405–409. - PMC - PubMed
    1. Basak P., Chatterjee S., Weger S., Bruce M.C., Murphy L.C., Raouf A. Estrogen regulates luminal progenitor cell differentiation through H19 gene expression. Endocr. Relat. Cancer. 2015;22:505–517. - PMC - PubMed
    1. Bhola N.E., Balko J.M., Dugger T.C., Kuba M.G., Sanchez V., Sanders M., Stanford J., Cook R.S., Arteaga C.L. TGF-beta inhibition enhances chemotherapy action against triple-negative breast cancer. J. Clin. Invest. 2013;123:1348–1358. - PMC - PubMed

Publication types

Substances