. 2018 Jan 15:638:8-17.
doi: 10.1016/j.abb.2017.12.009. Epub 2017 Dec 9.

Trichostatin A inhibits deacetylation of histone H3 and p53 by SIRT6

Affiliations

Trichostatin A inhibits deacetylation of histone H3 and p53 by SIRT6

Marci Wood et al. Arch Biochem Biophys. .

Abstract

SIRT6 is an epigenetic modification enzyme that regulates gene transcription through its deacetylase activity. In addition to histone protein, SIRT6 also modify other proteins and enzymes, some of which are central players in metabolic reprogramming and aging process. Therefore, SIRT6 has emerged as a therapeutic target for the treatment of metabolic disorder and age-related diseases. Here, we report that SIRT6 deacetylates lysine 382 of p53 in short synthetic peptide sequence and in full length p53. Further studies showed that the deacetylation of H3K9Ac and p53K382Ac are insensitive to nicotinamide inhibition, but are sensitive to trichostatin A (TSA) inhibition. Detailed kinetic analysis revealed that TSA competes with the peptide substrate for inhibition, and this inhibition is unique to SIRT6 in the sirtuin family. Taken together, this study not only suggests potential roles of SIRT6 in regulating apoptosis and stress resistance via direct deacetylation of p53, but also provides lead compound for the development of potent and selective SIRT6 inhibitors.

Keywords: Inhibition; NAD(+)-dependent deacetylation; Sirtuin.


Figures

Figure 1
Figure 1
SIRT6 deacetylates H3K9Ac and p53K382Ac in vitro. A. SIRT6 catalyzed NAD+-dependent deacetylation. B. HPLC chromatograms showing the deacetylation of H3K9Ac peptide by SIRT1 and SIRT6. C. HPLC chromatograms showing the deacetylation of p53K382Ac peptide by SIRT1 and SIRT6. D. HPLC chromatograms showing the production of NAM and AADPR in SIRT6 catalyzed deacetylation of H3K9Ac (a) and p53K382Ac (b). Trace c is the control experiment with no enzyme present.
Figure 2
Figure 2
Steady-state kinetic analysis of SIRT6 catalyzed deacetylation. Peptide saturation curves for H3K9Ac (circle) and p53K382Ac (square). Reactions containing 800 μM NAD+, and various concentrations of H3K9Ac or p53K382Ac in 100 mM phosphate buffer pH7.5 were initiated by the addition of 10 μM of SIRT6. The reactions were incubated at 37°C for 2 h and quenched by 8 μL of 10% TFA. Rates were determined as described in “Methods and Material”. Rates were plotted as a function of peptide concentration and fit to the Michaelis-Menten equation using Kaleidagraph®. Error bars represent S.D. of at least three replicates.
Figure 3
Figure 3
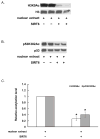
SIRT6 deacetylates full length H3 and p53. A. Western blots showing SIRT6 deacetylates full length histone H3. B. Western blots showing SIRT6 deacetylates full length p53. The gel images shown represent two replicates with the same condition. C. Quantification of A and B. The data represents average of as least three independent experiments ± S.D. Statistical significance was determined by a Student’s t-test: *p < 0.01 vs nuclear extract alone.
Figure 4
Figure 4
Nicotinamide base exchange catalyzed by SIRT6. A. Inhibition of the deacetylation by increasing concentrations of nicotinamide. The reactions were performed in 100 mM phosphate buffer pH 7.5 containing 800 μM NAD+, 500 μM H3K9Ac (circle) or 800 μM p53K382Ac (square), and various concentrations of NAM. The reactions were initiated by the addition of 10 μM of SIRT6 and were incubated at 37°C for 2 h before being quenched by 8 μL of 10% TFA. Rates were determined as described in “Methods and Material” and were plotted as a function of NAM concentration. The points were fitted to the equation: ν=ν0-νinh([I]Ki+[I]) using Kaleidagraph®. B. Kinetics of SIRT6 catalyzed base exchange of [carbonyl-14C]-nicotinamide into unlabeled NAD+. The reactions were carried out in 100 mM phosphate buffer pH 7.5 containing 800 μM NAD+, 1 mM H3K9Ac or p53K382Ac, 300,000 cpm [carbonyl-14C]-nicotinamide, and various concentrations of NAM. The reactions were initiated by the addition of 10 μM of SIRT6 and were incubated at 37°C for 2 h before being quenched by 8 μL of 10% TFA. Rates were determined as described in “Methods and Material” and were plotted as a function of NAM concentration. The pointes were fitted to the Michaelis-Menten equation using Kaleidagraph®. Error bars represent S.D. of at least three replicates.
Figure 5
Figure 5
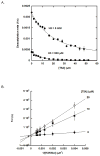
TSA inhibits SIRT6 catalyzed deacetylation of synthetic peptides. A. Determination of inhibition constant Ki of TSA. Reactions containing 800 μM NAD+, 500 μM or 5 mM H3K9Ac, varying concentrations of TSA in 100 mM phosphate buffer pH 7.5 were initiated by the addition of 10 μM of SIRT6, and were incubated at 37°C before being quenched by 8 μL of 10% TFA. Rates were determined as described in “Methods and Material” and plotted as a function of TSA concentration. Points were fitted to the Morrison’s quadratic equation to get the inhibition constant. B and C are the double-reciprocal inhibition plots. B. TSA exhibits competitive inhibition towards H3K9Ac in SIRT6 catalyzed reaction. Reactions containing either 0, 10 μM, or 20 μM TSA were incubated with 800 μM NAD+, varying concentrations of H3K9Ac in 100 mM phosphate buffer pH 7.5. The reactions were initiated by the addition of 10 μM of SIRT6 and were incubated at 37°C for 2 h before being quenched by 8 μL of 10% TFA. Rates were determined as described in “Methods and Material”. C. TSA exhibits non-competitive inhibition towards NAD+ in SIRT6 catalyzed reactions. Reactions containing either 0, 10 μM, or 20 μM TSA were incubated with 1 mM H3K9Ac, varying concentrations of NAD+ in 100 mM phosphate buffer pH 7.5. The reactions were initiated by the addition of 10 μM of SIRT6 and were incubated at 37°C for 2 h before being quenched by 8 μL of 10% TFA. Rates were determined as described in “Methods and Material”. Double reciprocal plots were generated using Kaleidagraph® and fit to a linear curve representative of the Lineweaver-Burk relationship. Error bars represent S.D. of three replicates.
Figure 5
Figure 5
TSA inhibits SIRT6 catalyzed deacetylation of synthetic peptides. A. Determination of inhibition constant Ki of TSA. Reactions containing 800 μM NAD+, 500 μM or 5 mM H3K9Ac, varying concentrations of TSA in 100 mM phosphate buffer pH 7.5 were initiated by the addition of 10 μM of SIRT6, and were incubated at 37°C before being quenched by 8 μL of 10% TFA. Rates were determined as described in “Methods and Material” and plotted as a function of TSA concentration. Points were fitted to the Morrison’s quadratic equation to get the inhibition constant. B and C are the double-reciprocal inhibition plots. B. TSA exhibits competitive inhibition towards H3K9Ac in SIRT6 catalyzed reaction. Reactions containing either 0, 10 μM, or 20 μM TSA were incubated with 800 μM NAD+, varying concentrations of H3K9Ac in 100 mM phosphate buffer pH 7.5. The reactions were initiated by the addition of 10 μM of SIRT6 and were incubated at 37°C for 2 h before being quenched by 8 μL of 10% TFA. Rates were determined as described in “Methods and Material”. C. TSA exhibits non-competitive inhibition towards NAD+ in SIRT6 catalyzed reactions. Reactions containing either 0, 10 μM, or 20 μM TSA were incubated with 1 mM H3K9Ac, varying concentrations of NAD+ in 100 mM phosphate buffer pH 7.5. The reactions were initiated by the addition of 10 μM of SIRT6 and were incubated at 37°C for 2 h before being quenched by 8 μL of 10% TFA. Rates were determined as described in “Methods and Material”. Double reciprocal plots were generated using Kaleidagraph® and fit to a linear curve representative of the Lineweaver-Burk relationship. Error bars represent S.D. of three replicates.
Figure 6
Figure 6
TSA inhibits SIRT6 catalyzed deacetylation of full length H3 and p53. Representative western blot (A) and quantification analysis (B) showing that TSA inhibits the deacetylation of H3K9 and p53K382 in HEK293 cell nuclear extract in a dose-dependent manner. Representative western blot (C) and quantification analysis (D) showing that NAM only marginally inhibits SIRT6 catalyzed deacetylation of H3K9 and p53K382 in HEK293 cell nuclear extract. The quantification data represents average of three independent experiments ± S.D. Statistical significance was determined by a Student’s t-test: *p < 0.01 vs nuclear extract alone; #p < 0.01 vs SIRT6 and NAD+ treatment; p < 0.05 vs SIRT6 and NAD+ treatment.
Figure 6
Figure 6
TSA inhibits SIRT6 catalyzed deacetylation of full length H3 and p53. Representative western blot (A) and quantification analysis (B) showing that TSA inhibits the deacetylation of H3K9 and p53K382 in HEK293 cell nuclear extract in a dose-dependent manner. Representative western blot (C) and quantification analysis (D) showing that NAM only marginally inhibits SIRT6 catalyzed deacetylation of H3K9 and p53K382 in HEK293 cell nuclear extract. The quantification data represents average of three independent experiments ± S.D. Statistical significance was determined by a Student’s t-test: *p < 0.01 vs nuclear extract alone; #p < 0.01 vs SIRT6 and NAD+ treatment; p < 0.05 vs SIRT6 and NAD+ treatment.

Similar articles

Cited by

References

    1. Sauve AA, Wolberger C, Schramm VL, Boeke JD. The biochemistry of sirtuins. Annual review of biochemistry. 2006;75:435–65. - PubMed
    1. Haigis MC, Sinclair DA. Mammalian sirtuins: biological insights and disease relevance. Annual review of pathology. 2010;5:253–95. - PMC - PubMed
    1. Zhang S, Chen P, Huang Z, Hu X, Chen M, Hu S, Hu Y, Cai T. Sirt7 promotes gastric cancer growth and inhibits apoptosis by epigenetically inhibiting miR-34a. Scientific reports. 2015;5:9787. - PMC - PubMed
    1. Liu Z, Gu H, Gan L, Xu Y, Feng F, Saeed M, Sun C. Reducing Smad3/ATF4 was essential for Sirt1 inhibiting ER stress-induced apoptosis in mice brown adipose tissue. Oncotarget. 2017;8(6):9267–9279. - PMC - PubMed
    1. Xiao C, Kim HS, Lahusen T, Wang RH, Xu X, Gavrilova O, Jou W, Gius D, Deng CX. SIRT6 deficiency results in severe hypoglycemia by enhancing both basal and insulin-stimulated glucose uptake in mice. The Journal of biological chemistry. 2010;285(47):36776–84. - PMC - PubMed

Publication types