. 2018 Jan;28(1):66-74.
doi: 10.1101/gr.219303.116. Epub 2017 Dec 12.

DNA mismatch repair preferentially protects genes from mutation

Affiliations

DNA mismatch repair preferentially protects genes from mutation

Eric J Belfield et al. Genome Res. 2018 Jan.

Abstract

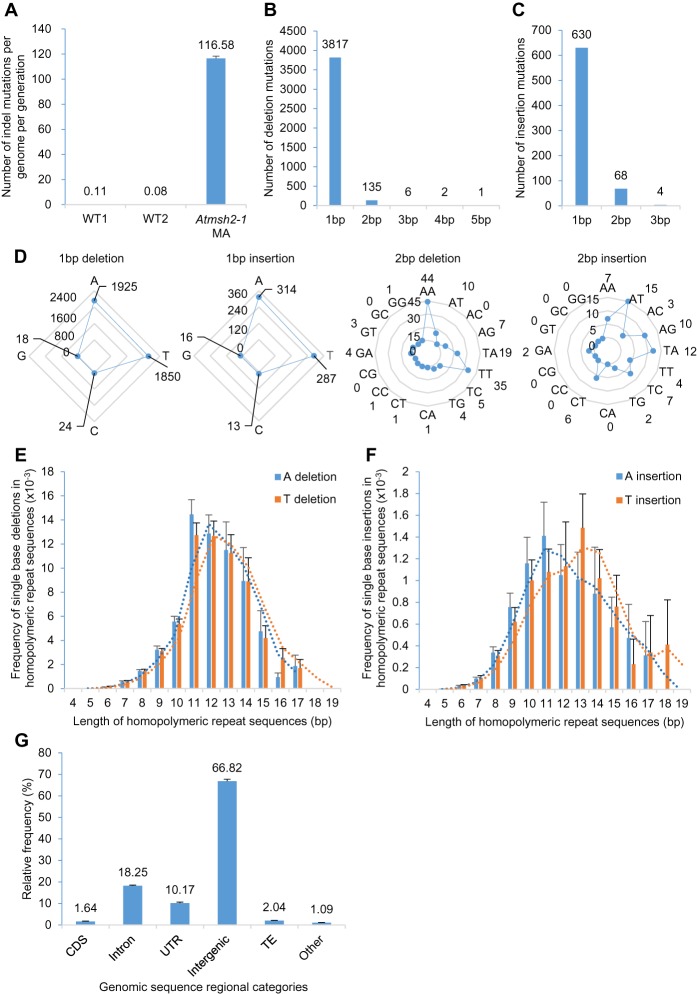
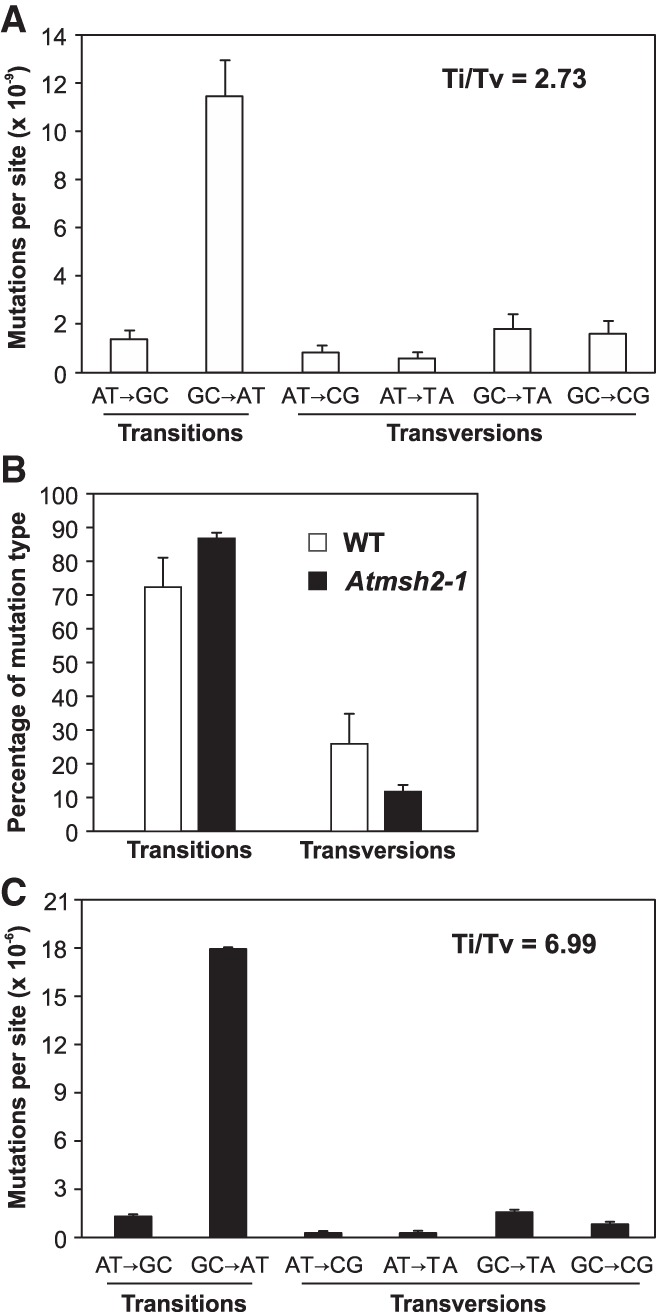
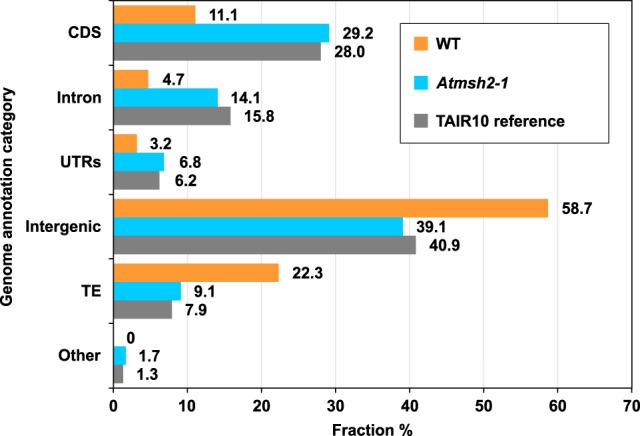
Mutation is the source of genetic variation and fuels biological evolution. Many mutations first arise as DNA replication errors. These errors subsequently evade correction by cellular DNA repair, for example, by the well-known DNA mismatch repair (MMR) mechanism. Here, we determine the genome-wide effects of MMR on mutation. We first identify almost 9000 mutations accumulated over five generations in eight MMR-deficient mutation accumulation (MA) lines of the model plant species, Arabidopsis thaliana We then show that MMR deficiency greatly increases the frequency of both smaller-scale insertions and deletions (indels) and of single-nucleotide variant (SNV) mutations. Most indels involve A or T nucleotides and occur preferentially in homopolymeric (poly A or poly T) genomic stretches. In addition, we find that the likelihood of occurrence of indels in homopolymeric stretches is strongly related to stretch length, and that this relationship causes ultrahigh localized mutation rates in specific homopolymeric stretch regions. For SNVs, we show that MMR deficiency both increases their frequency and changes their molecular mutational spectrum, causing further enhancement of the GC to AT bias characteristic of organisms with normal MMR function. Our final genome-wide analyses show that MMR deficiency disproportionately increases the numbers of SNVs in genes, rather than in nongenic regions of the genome. This latter observation indicates that MMR preferentially protects genes from mutation and has important consequences for understanding the evolution of genomes during both natural selection and human tumor growth.


Figures

Figure 1.
Figure 1.
Establishment of MMR-deficient A. thaliana mutation accumulation (MA) lines and overview of mutations identified. (A) Steps in the generation of MA lines: (1) preparation of Generation 0 (G0) Atmsh2-1 Ancestor; (2) determination of Atmsh2-1 Ancestor whole-genome sequence; (3) creation of independent MA lines by self-pollination of Atmsh2-1 Ancestor and subsequent single-seed descent; (4) recovery of 40 fifth generation (G5) MA line plants; and (5) determination of whole-genome sequence of eight G5 MA line plant samples. (B) Overview of total mutations accumulated in all eight G5 Atmsh2-1 MA line plant samples. Deletions are 1–5 bp in size; insertions are 1–3 bp in size; SNVs are single-nucleotide variants (single-nucleotide substitutions).
Figure 2.
Figure 2.
Characterization of indel mutations in MMR-deficient A. thaliana. (A) Frequency of indels (insertions and deletions) in G5 Atmsh2-1 MA line samples compared with that in wild-type (WT) controls (WT1 data from Ossowski et al. 2010; WT2 data from Jiang et al. 2014). Error bars indicate SEM (too small to be clearly visible in WT1 and WT2). (B,C) Length distributions (in bps) of indels in G5 Atmsh2-1 MA line samples: (B) deletions; (C) insertions. (D) Comparison of different classes of 1- and 2-bp indels accumulated in G5 Atmsh2-1 MA line samples. (E,F) Frequency of single-base A or T deletions (E) or A or T insertions (F) in different length categories of homopolymeric A or T repeat regions (values normalized by the number of each length category of homopolymeric A or T repeat region in the A. thaliana genome) (Supplemental Fig. 2A,B). Dotted lines indicate moving average trends. (G) Genomic distribution of indels in G5 Atmsh2-1 MA line samples. (CDS) coding sequence; (UTR) untranslated region; (TE) transposable element; (Other) noncoding RNAs and pseudogenes. Error bars in EG indicate SEM (from eight different Atmsh2-1 MA biological replicates) (Supplemental Table 4).
Figure 3.
Figure 3.
Comparisons of SNV mutational spectra in WT and MMR-deficient A. thaliana. (A) Mutation spectrum and Ti/Tv ratio in MMR-proficient WT MA lines (data from Ossowski et al. 2010). (B) Relative percentage of transitions versus transversions in G5 Atmsh2-1 MA line plants versus that seen in MMR-proficient WT MA lines (WT data from Ossowski et al. 2010). (C) Mutation spectrum and Ti/Tv ratio of SNVs detected in MMR-deficient G5 Atmsh2-1 MA line plants. Error bars (AC) indicate SEM from five (WT data) or eight (MMR-deficient data) biological replicates (in some cases, too small to be clearly visible).
Figure 4.
Figure 4.
Flanking sequence bias at SNV sites in MMR-deficient A. thaliana. Nucleotide flanking sequences 10 bases upstream (5′) and downstream (3′) from each mutated site are shown as stacked columns and sequence logos (Schneider and Stephens 1990; Crooks et al. 2004). (A) Combined 1470 C-to-T and 1807 reverse complemented G-to-A to C-to-T mutations in G5 Atmsh2-1 MA line samples. (B) The haploid flanking sequence composition for all C and reverse complemented G sites in the TAIR10 A. thaliana reference genome. (C) The combined flanking sequences at sites of spontaneous C-to-T and reverse complemented G-to-A to C-to-T transition site mutations identified in WT (MMR-proficient) A. thaliana MA lines (Ossowski et al. 2010; Jiang et al. 2014). Sequence logos showing graphical representations of the relative frequencies of individual nucleotide residues with respect to position within the flanking sequences are shown as stacked letters, along with the number of sites (combined C and reverse complemented G-to-A to C-to-T sites) considered (shown as N). The letters in each stack are ordered from most (top) to least (bottom) frequent. The overall height of each stack indicates the sequence conservation at that position (measured in bits), whereas the height of each letter within the stack indicates the relative frequency of each nucleotide (A, T, C, or G) at that position (Crooks et al. 2004).
Figure 5.
Figure 5.
Genome-wide distribution of SNV mutations in WT and Atmsh2-1 A. thaliana MA lines. Gray bars show the relative distribution of A. thaliana reference genome annotation categories (expressed as a percentage of the total genome): (CDS) coding DNA sequence; (UTRs) untranslated regions; (TE) transposable element; (Other) noncoding RNAs and pseudogenes. Orange bars show relative distribution (%) of SNVs in WT MA lines between different genomic annotation categories; data from Ossowski et al. (2010) and Jiang et al. (2014) were averaged for each genomic annotation category. Blue bars show relative distribution (%) of SNVs in MMR-deficient Atmsh2-1 MA lines between different genomic annotation categories. Number (N) of WT SNVs from Ossowski et al. (2010), N = 98; from Jiang et al. (2014), N = 44. Number of Atmsh2-1 SNVs, N = 4048.

References

    1. The Arabidopsis Genome Initiative. 2000. Analysis of the genome sequence of the flowering plant Arabidopsis thaliana. Nature 408: 796–815. - PubMed
    1. Baer CF, Shaw F, Steding C, Baumgartner M, Hawkins A, Houppert A, Mason N, Reed M, Simonelic K, Woodard W, et al. 2005. Comparative evolutionary genetics of spontaneous mutations affecting fitness in rhabditid nematodes. Proc Natl Acad Sci 102: 5785–5790. - PMC - PubMed
    1. Belfield EJ, Gan X, Mithani A, Brown C, Jiang C, Franklin K, Alvey E, Wibowo A, Jung M, Bailey K, et al. 2012. Genome-wide analysis of mutations in mutant lineages selected following fast-neutron irradiation mutagenesis of Arabidopsis thaliana. Genome Res 22: 1306–1315. - PMC - PubMed
    1. Buermeyer AB, Deschenes SM, Baker SM, Liskay RM. 1999. Mammalian DNA mismatch repair. Annu Rev Genet 33: 533–564. - PubMed
    1. Crooks GE, Hon G, Chandonia JM, Brenner SE. 2004. WebLogo: a sequence logo generator. Genome Res 14: 1188–1190. - PMC - PubMed

Publication types

LinkOut - more resources