. 2017 Dec 26;114(52):E11228-E11237.
doi: 10.1073/pnas.1713664114. Epub 2017 Dec 12.

ATG-dependent phagocytosis in dendritic cells drives myelin-specific CD4+ T cell pathogenicity during CNS inflammation

Affiliations

ATG-dependent phagocytosis in dendritic cells drives myelin-specific CD4+ T cell pathogenicity during CNS inflammation

Christian W Keller et al. Proc Natl Acad Sci U S A. .

Abstract

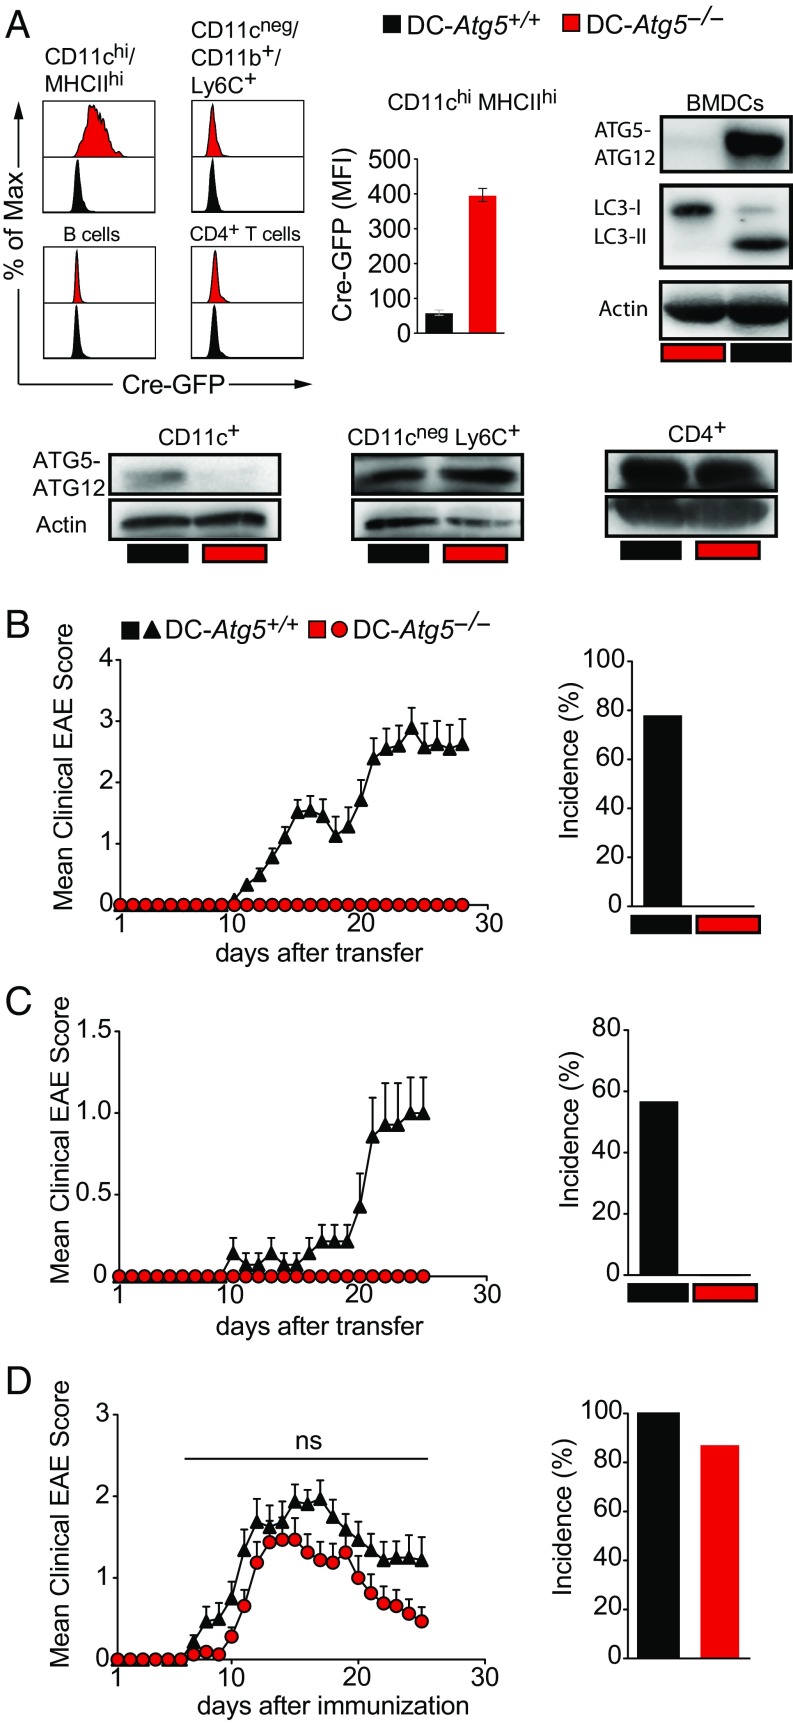
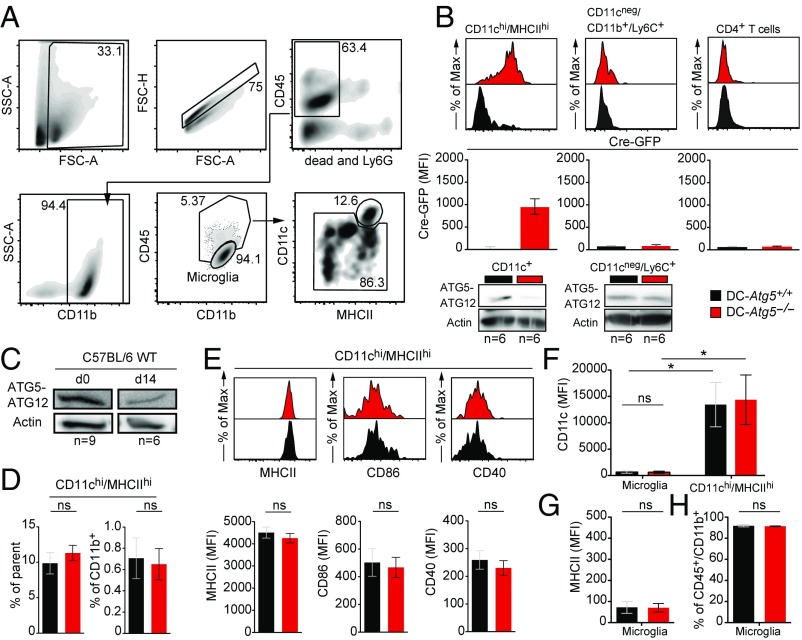
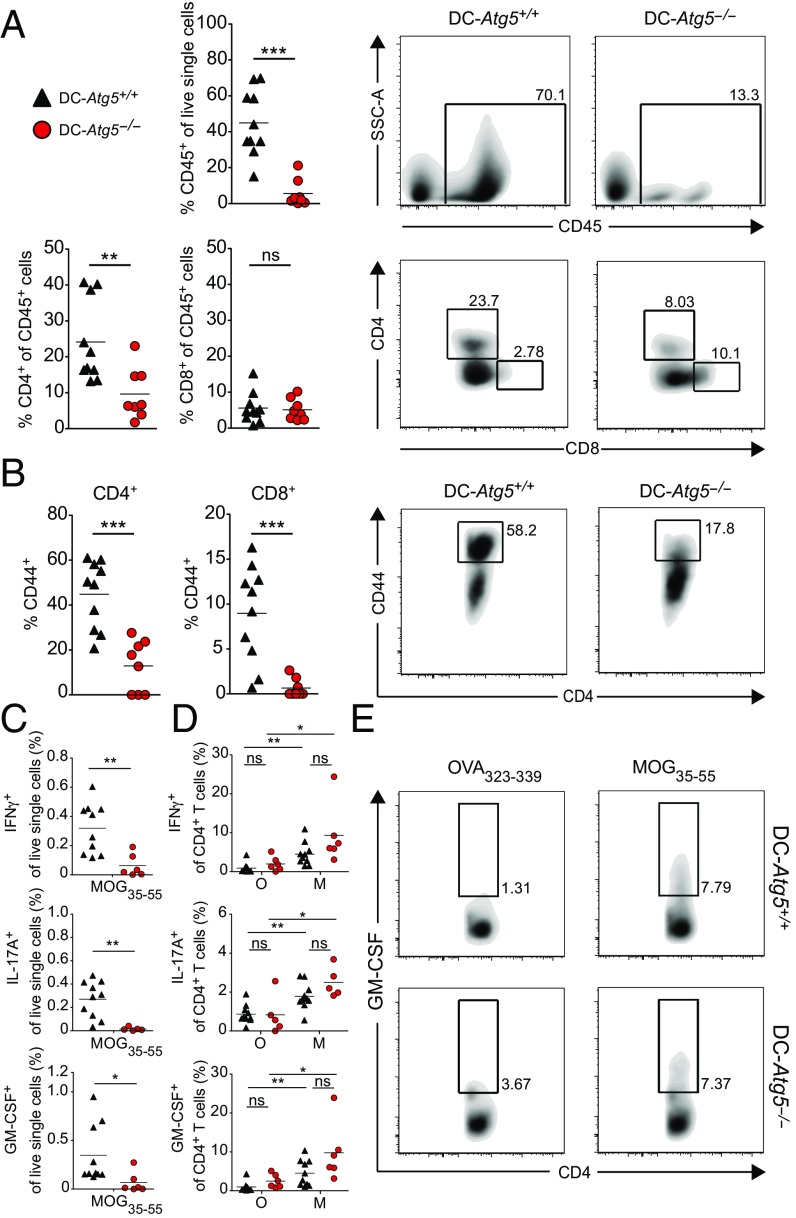
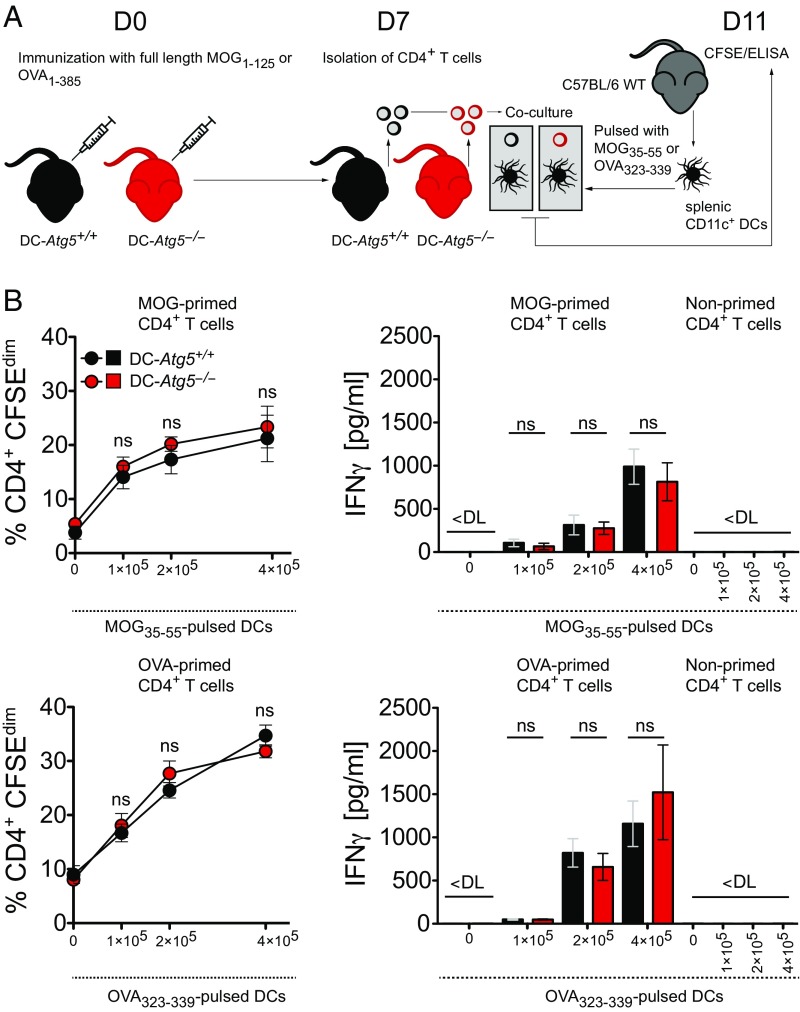
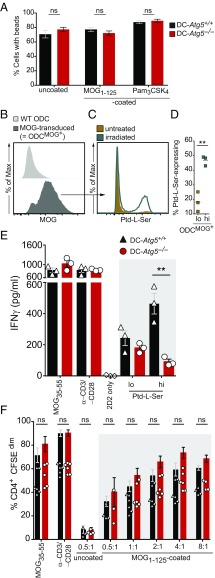
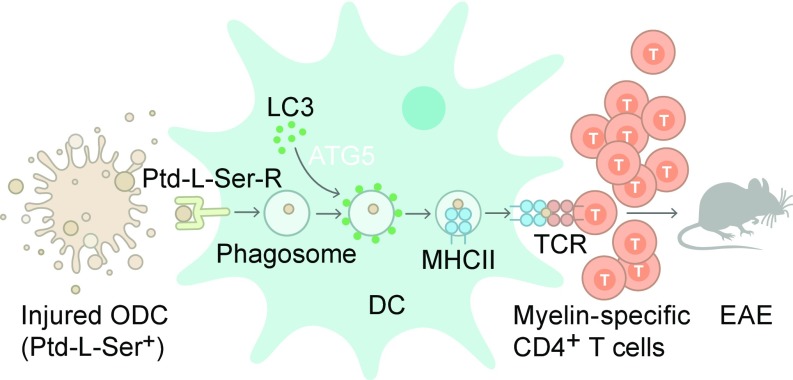
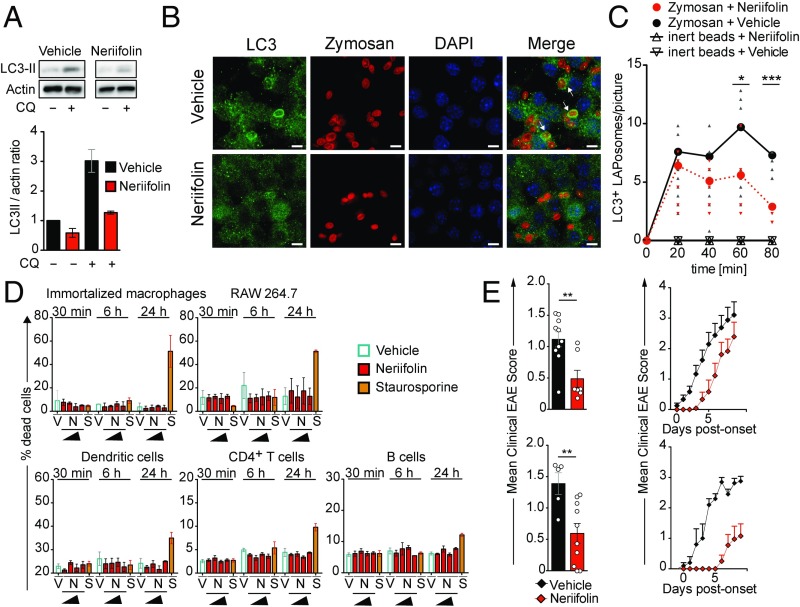
Although reactivation and accumulation of autoreactive CD4+ T cells within the CNS are considered to play a key role in the pathogenesis of multiple sclerosis (MS) and its animal model, experimental autoimmune encephalomyelitis (EAE), the mechanisms of how these cells recognize their target organ and induce sustained inflammation are incompletely understood. Here, we report that mice with conditional deletion of the essential autophagy protein ATG5 in classical dendritic cells (DCs), which are present at low frequencies in the nondiseased CNS, are completely resistant to EAE development following adoptive transfer of myelin-specific T cells and show substantially reduced in situ CD4+ T cell accumulation during the effector phase of the disease. Endogenous myelin peptide presentation to CD4+ T cells following phagocytosis of injured, phosphatidylserine-exposing oligodendroglial cells is abrogated in the absence of ATG5. Pharmacological inhibition of ATG-dependent phagocytosis by the cardiac glycoside neriifolin, an inhibitor of the Na+, K+-ATPase, delays the onset and reduces the clinical severity of EAE induced by myelin-specific CD4+ T cells. These findings link phagocytosis of injured oligodendrocytes, a pathological hallmark of MS lesions and during EAE, with myelin antigen processing and T cell pathogenicity, and identify ATG-dependent phagocytosis in DCs as a key regulator in driving autoimmune CD4+ T cell-mediated CNS damage.

Keywords: EAE; autophagy; multiple sclerosis; neuroinflammation.


Conflict of interest statement

The authors declare no conflict of interest.

Figures

Fig. 1.
Fig. 1.
DC-Atg5−/− mice are resistant to EAE induced by primed, myelin-specific T cells. (A) Representative histograms depicting Cre-GFP expression of either CD11c+MHCII+ splenic DCs (cDCs), CD11cnegCD11b+Ly6C+ monocytes, B cells, or CD4+ T cells in DC-Atg5+/+ (black) or DC-Atg5−/− (red) mice in steady state (Upper Left). Quantification of Cre-GFP median fluorescence intensity (MFI; DC-Atg5+/+, n = 7; DC-Atg5−/−, n = 9) (Upper Middle). Western blot analysis for protein expression of the ATG5–ATG12 complex, LC3-I, and LC3-II in CD11c+ BMDCs (Upper Right) and protein expression of the ATG5–ATG12 complex in primary splenic cell populations CD11c+, CD11cnegLy6C+, and CD4+ (Lower) derived from DC-Atg5+/+ or DC-Atg5−/− mice is depicted. Actin served as a loading control. One representative of two experiments is shown. (B) EAE was induced via adoptively transferring 2D2/TCRMOG-derived encephalitogenic CD4+ T cells into DC-Atg5+/+ (black triangles) or DC-Atg5−/− mice (red circles). Each data point represents the mean of 44 or more animals. Pooled data of eight independent experiments are shown (Left). Quantification of disease incidence is shown (Right). (C) EAE was induced via adoptively transferring C57BL/6 wild type-derived encephalitogenic CD4+ T cells into DC-Atg5+/+ or DC-Atg5−/− mice. Each data point represents the mean of seven animals (Left). One representative of two independent experiments is shown. Quantification of disease incidence is shown (Right). (D) EAE was induced via active immunization with MOG35–55 peptide in DC-Atg5+/+ or DC-Atg5−/− mice. Each data point represents the mean of 15 or more animals. Pooled data of three independent experiments are shown (Left). Quantification of disease incidence is shown (Right). Statistical analysis: Mean ± SEM is depicted. Two-way ANOVA (D, Left) was applied. ns, not significant: P > 0.05.
Fig. 2.
Fig. 2.
CD11c+ Cre-GFP–expressing DCs in the CNS before EAE induction. (A) Gating strategy for flow cytometry analysis in the CNS of naïve DC-Atg5+/+ and DC-Atg5−/− mice. First, single leukocytes were defined by applying the respective gates (leukocytes: SSC-A vs. FSC-A; single cells: FSC-H vs. FSC-A). Next, CD45+ cells were gated on, while excluding Ly6G+ neutrophils and dead cells. After gating on CD11b+ myeloid cells, microglia were defined as CD45loCD11b+. Inside the CD45hiCD11b+ cell gate, it was further gated on CD11chiMHCIIhi cells. Within the remainder of the cells it was subgated on CD11cnegCD11b+Ly6C+ monocytes (not shown). (B) Representative histograms (Upper) depicting Cre-GFP expression of either CNS-resident CD11chiMHCIIhi cells (Upper Left) or CNS-derived CD11cnegCD11b+Ly6C+ monocytes (Upper Middle) in naïve mice. Representative histogram depicting Cre-GFP expression in CNS-infiltrating CD4+ T cells at the peak of disease (day 21 ± 1) (Upper Right). Quantification of Cre-GFP MFI is depicted (Middle). Western blot analysis for protein expression of the ATG5–ATG12 complex in CNS-derived CD11c+ cells (Lower Left) and CD11cnegLy6C+ cells (Lower Right) (DC-Atg5+/+, n = 6; DC-Atg5−/−, n = 6). Actin served as a loading control. (C) Western blot analysis for protein expression of the ATG5–ATG12 complex in CNS-derived CD11c+ cells of C57BL/6 wild-type (WT) mice before induction of adoptive transfer EAE (n = 9) or on day 14 after induction of adoptive transfer EAE (n = 6). Actin served as a loading control. (D) Quantified frequencies (percentage of parent, Left; percentage of CD11b+ cells, Right) of CNS-resident CD11chiMHCIIhi cells in naïve DC-Atg5+/+ and DC-Atg5−/− mice. (E) Representative histograms (Upper) depicting either MHCII (Left), CD86 (Middle), or CD40 (Right) MFI of CNS-resident CD11chiMHCIIhi cells. Quantification of MFI values is shown (Lower). (F) Microglia versus CD11chiMHCIIhi cell phenotypes in DC-Atg5−/− mice before EAE induction. CD45lo/intCD11b+ microglial cells do not express CD11c to a substantial level at steady state compared with CD11chiMHCIIhi CNS cells. (G) Surface expression levels of MHCII are similar on microglia when comparing DC-Atg5+/+ and DC-Atg5−/− mice. (H) Frequencies of CD45lo/intCD11b+ microglial cells are unchanged in DC-Atg5−/− mice. Pooled data of two independent experiments are shown (DC-Atg5+/+, n = 5 and DC-Atg5−/−, n = 5 for naïve myeloid compartments; DC-Atg5+/+, n = 10 and DC-Atg5−/−, n = 12 for peak of disease CD4+ T cell analysis). Statistical analysis: Mean ± SEM is depicted. Unpaired two-tailed Student t test was applied. ns, not significant: P > 0.05; *P < 0.05.
Fig. 3.
Fig. 3.
Lack of ATG5 in CD11c+ DCs limits accumulation of encephalitogenic CD4+ T cells within the CNS. (A) Twenty-one days (±1) after adoptive transfer EAE induction, DC-Atg5−/− mice exhibit significantly fewer CD45+ infiltrates in the CNS. Furthermore, quantification of immune cell subsets shows significantly lower proportions of CD4+ T cells in DC-Atg5−/− compared with DC-Atg5+/+ mice at the peak of disease in the CNS, whereas no difference is observed in the CD8+ T cell compartment. (B) At the peak of disease, DC-Atg5−/− mice exhibit significantly lower frequencies of activated CD44+/CD4+ and CD8+ T cells in the CNS. (C) The ability of CNS-invading CD4+ T cells to produce proinflammatory cytokines was determined. Leukocytes were isolated and purified from the CNS at the peak of disease (day 21 ± 1). For each animal the CNS-derived cell suspension was divided into two groups, and cells were restimulated for 4 h with either MOG35–55 peptide (M) or OVA323–339 peptide (O). CNS-infiltrating CD4+ T cells in DC-Atg5−/− mice maintain their capacity to produce effector cytokines. DC-Atg5+/+ mice contain significantly more (percentage of live single cells) cytokine-producing MOG35–55–specific CD4+ T cells in the CNS than DC-Atg−/− mice. (D) Both DC-Atg5−/−– and DC-Atg5+/+–derived CD4+ T cells are capable of secreting cytokines (IFNγ, IL-17A, and GM-CSF) upon restimulation with MOG35–55 (but not with OVA323–339) to similar degrees. (E) Representative density plot for GM-CSF+ CD4+ T cells in the CNS of DC-Atg5−/− or DC-Atg5+/+ mice at the peak of disease. Pooled data of two independent experiments are shown. Statistical analysis: Mean is depicted. Unpaired two-tailed Student t test was applied. ns, not significant: P > 0.05; *P < 0.05, **P < 0.01, ***P < 0.001.
Fig. 4.
Fig. 4.
Loss of ATG5 in DCs does not impair priming of antigen-specific CD4+ T cells. (A) Experimental setup. (B) Quantification of DC-Atg5−/−– and DC-Atg5+/+–derived CD4+ T cell proliferation via carboxyfluorescein succinimidyl ester (CFSE) dilution in the presence of increasing amounts of wild type-derived peptide-pulsed DCs (Upper and Lower Left). CD4+ T cell response (IFNγ secretion) is unchanged upon coculture with peptide-pulsed DCs (Upper and Lower Right). Pooled data of two independent experiments are shown. Statistical analysis: Mean ± SEM is depicted. Unpaired two-tailed Student t test was applied. ns, not significant: P > 0.05. DL, detection limit.
Fig. 5.
Fig. 5.
Endogenous myelin presentation by CD11c+ DCs is abrogated in the absence of ATG5. (A) DC-Atg5−/−– and DC-Atg5+/+–derived BMDCs were incubated for 4 h with either uncoated, MOG1–125–coated, or Pam3CSK4–coated polystyrene beads, and the percentage of bead-containing cells was quantified via confocal microscopy. (B) Representative histogram comparing MOG-transduced oligodendroglial cell line MO3.13 (ODCMOG+) with wild-type MO3.13 cells (WT ODC) for surface MOG expression. (C) ODCMOG+ were either UVB–irradiated (870 mJ/cm2) or left untreated, which resulted in Ptd-l-Serhi– and Ptd-l-Serlo–expressing ODCMOG+. (D) Quantification via annexin V staining. Pooled data of three independent experiments are shown. (E) Coculture of MOG-specific 2D2/TCRMOG-derived CD4+ T cells with splenic CD11c+ DCs that had previously been pulsed with either Ptd-l-Serhi– or Ptd-l-Serlo–expressing ODCMOG+. CD4+ T cell response (IFNγ secretion) is augmented upon coculture with ODCMOG+-pulsed Ptd-l-Serhi DCs. Absence of ATG5 in DCs abrogates CD4+ T cell response upon coculture with ODCMOG+-pulsed Ptd-l-Serhi DCs. One representative of >3 independent experiments is shown. (F) Coculture of 2D2/TCRMOG-derived CD4+ with DC-Atg5−/−– and DC-Atg5+/+–derived FAC-sorted splenic DCs in the presence of MOG1–125–coated beads. Different bead:DC ratios are depicted. CD4+ T cell proliferation was quantified via CFSE dilution. Pooled data of three independent experiments are shown. Statistical analysis: Mean ± SEM is depicted. Unpaired two-tailed Student t test was applied. ns, not significant: P > 0.05; **P < 0.01.
Fig. 6.
Fig. 6.
Provision of injured oligodendrocyte-derived antigenic material via ATG5-dependent phagocytosis. Schematic depiction summarizing how ATG5-dependent phagocytosis contributes to the provision of injured oligodendrocyte (ODC)-derived antigenic material to the MHC class II antigen presentation pathway in CNS DCs. Parts of compromised, Ptd-l-Ser+ ODCs are phagocytosed upon ligation of Ptd-l-Ser receptors (Ptd-l-Ser-Rs) triggering ATG5-dependent phagocytosis. LC3-I is converted into LC3-II in an ATG5-dependent manner and recruited to the single-membrane phagosome, which fuses with MHC class II-containing compartments. Myelin-derived antigenic material will be subsequently presented to encephalitogenic T cells, facilitating the development and maintenance of neuroinflammation.
Fig. 7.
Fig. 7.
Cardiac glycoside neriifolin inhibits ATG-dependent phagocytosis and delays onset of EAE. (A) Western blot analysis for protein expression of LC3-II in RAW 264.7 cells in the absence (vehicle, 0.5% ethanol in PBS) or presence of neriifolin (1 µM). Actin served as a loading control. One representative of eight independent experiments (Upper) and quantification of Western blot analyses (Lower) are shown. (B) Immunofluorescence confocal laser scanning microscopy of RAW 264.7 cells (neriifolin, 1 µM; vehicle, 0.5% ethanol in PBS) visualizing LC3 (green), zymosan (red), and DAPI (blue). Representative pictures from the 80-min time point are depicted. Original magnification with 63×, 1.4 N.A. oil immersion lens. White arrows indicate LC3-decorated, zymosan-containing LAPosomes. (Scale bars, 5 µm.) (C) Quantification and kinetics of zymosan-triggered LAPosome formation in the absence (vehicle, 0.5% ethanol in PBS) or presence of neriifolin (1 µM). Non–LAP-triggering inert polystyrene beads were used as a control. (D) FACS analysis of neriifolin cytotoxicity using myeloid cell lines and primary (splenic) CD11chiMHCIIhi dendritic cells, CD3+CD4+ T cells, and CD19+MHCII+ B cells. Cells were exposed to increasing amounts of neriifolin (N; 0.1, 1, 10, and 1,000 nM) for either 30 min, 6 h, or 24 h. The protein kinase inhibitor staurosporine (S; 1 µM) was used as a positive and vehicle (V; 0.5% ethanol in PBS) as a negative control. (E) Neriifolin treatment (0.25 mg/kg; vehicle, 0.5% ethanol in PBS) delays onset and ameliorates disease severity of adoptive transfer (Upper) and active (Lower) EAE. Pooled data of two independent experiments are depicted. Each dot represents one individual animal. Statistical analysis: Mean ± SEM is depicted. Unpaired two-tailed Student t test was applied. *P < 0.05, **P < 0.01, ***P < 0.001. CQ, chloroquine.

References

    1. Sawcer S, et al. International Multiple Sclerosis Genetics Consortium; Wellcome Trust Case Control Consortium 2 Genetic risk and a primary role for cell-mediated immune mechanisms in multiple sclerosis. Nature. 2011;476:214–219. - PMC - PubMed
    1. Beecham AH, et al. International Multiple Sclerosis Genetics Consortium (IMSGC); Wellcome Trust Case Control Consortium 2 (WTCCC2); International IBD Genetics Consortium (IIBDGC) Analysis of immune-related loci identifies 48 new susceptibility variants for multiple sclerosis. Nat Genet. 2013;45:1353–1360. - PMC - PubMed
    1. Babbe H, et al. Clonal expansions of CD8(+) T cells dominate the T cell infiltrate in active multiple sclerosis lesions as shown by micromanipulation and single cell polymerase chain reaction. J Exp Med. 2000;192:393–404. - PMC - PubMed
    1. Sospedra M, et al. Redundancy in antigen-presenting function of the HLA-DR and -DQ molecules in the multiple sclerosis-associated HLA-DR2 haplotype. J Immunol. 2006;176:1951–1961. - PMC - PubMed
    1. Planas R, et al. Central role of Th2/Tc2 lymphocytes in pattern II multiple sclerosis lesions. Ann Clin Transl Neurol. 2015;2:875–893. - PMC - PubMed

Publication types

MeSH terms

Substances

LinkOut - more resources