. 2017 Dec 12;8(1):2052.
doi: 10.1038/s41467-017-02097-9.

PEPD is a pivotal regulator of p53 tumor suppressor

Affiliations

PEPD is a pivotal regulator of p53 tumor suppressor

Lu Yang et al. Nat Commun. .

Abstract

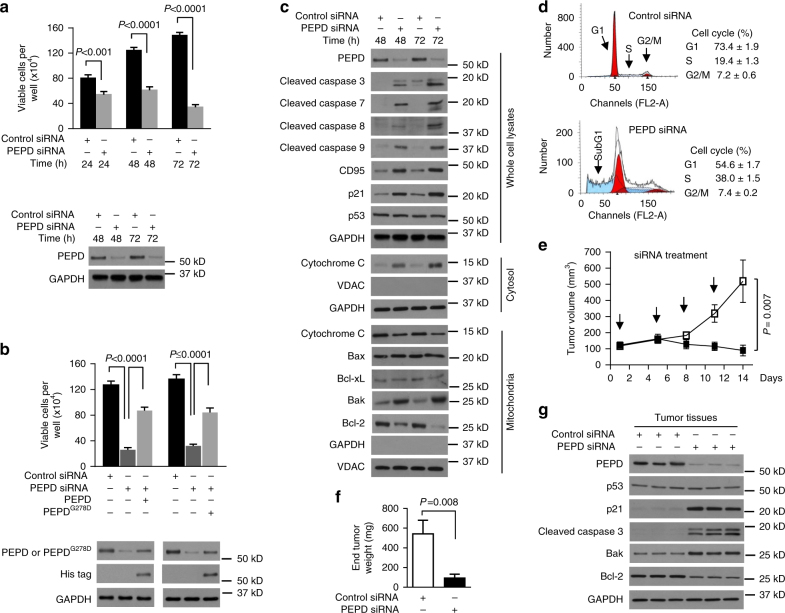
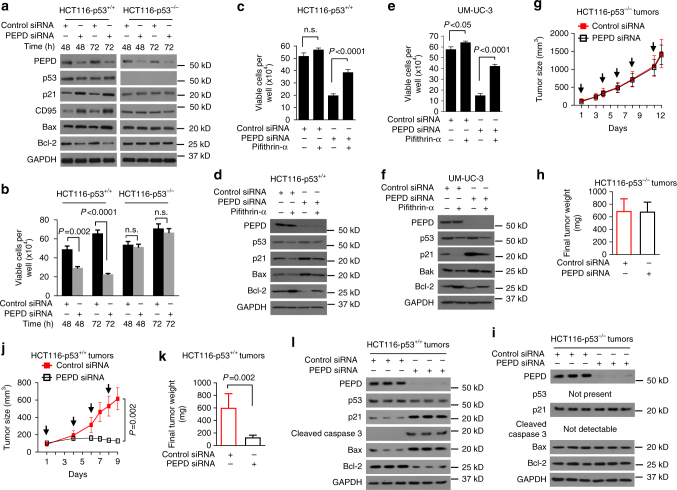
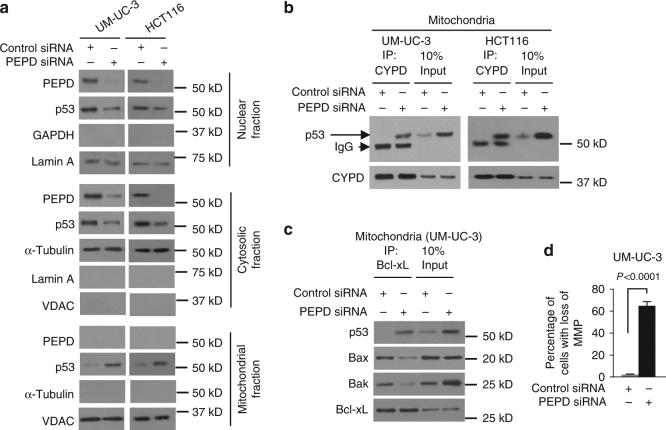
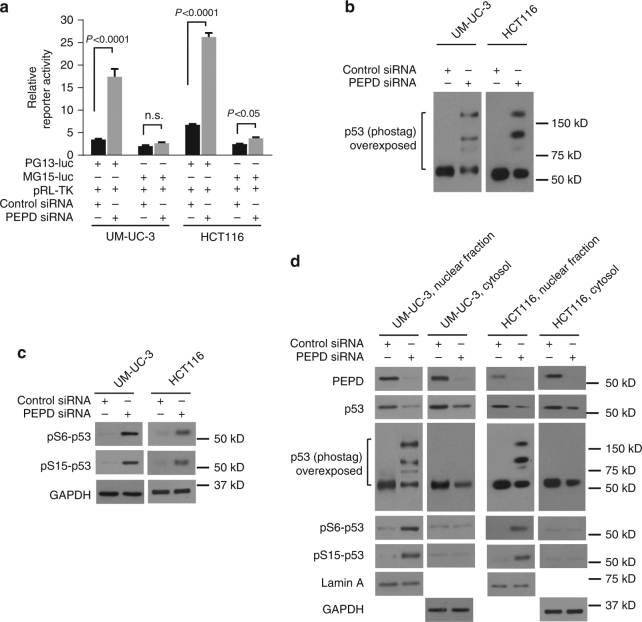
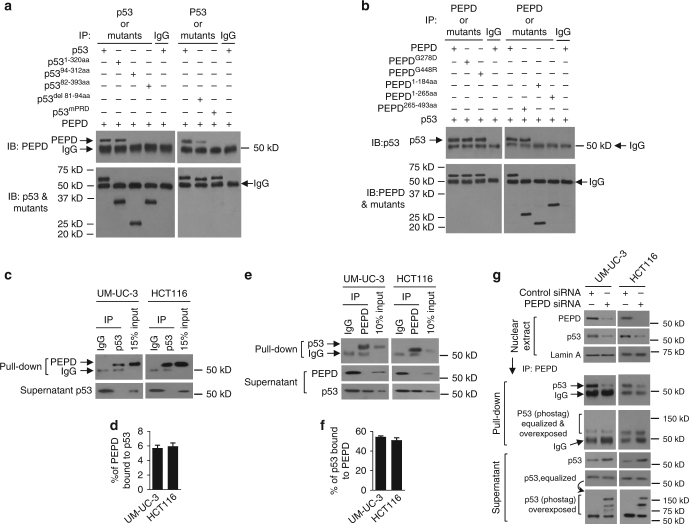
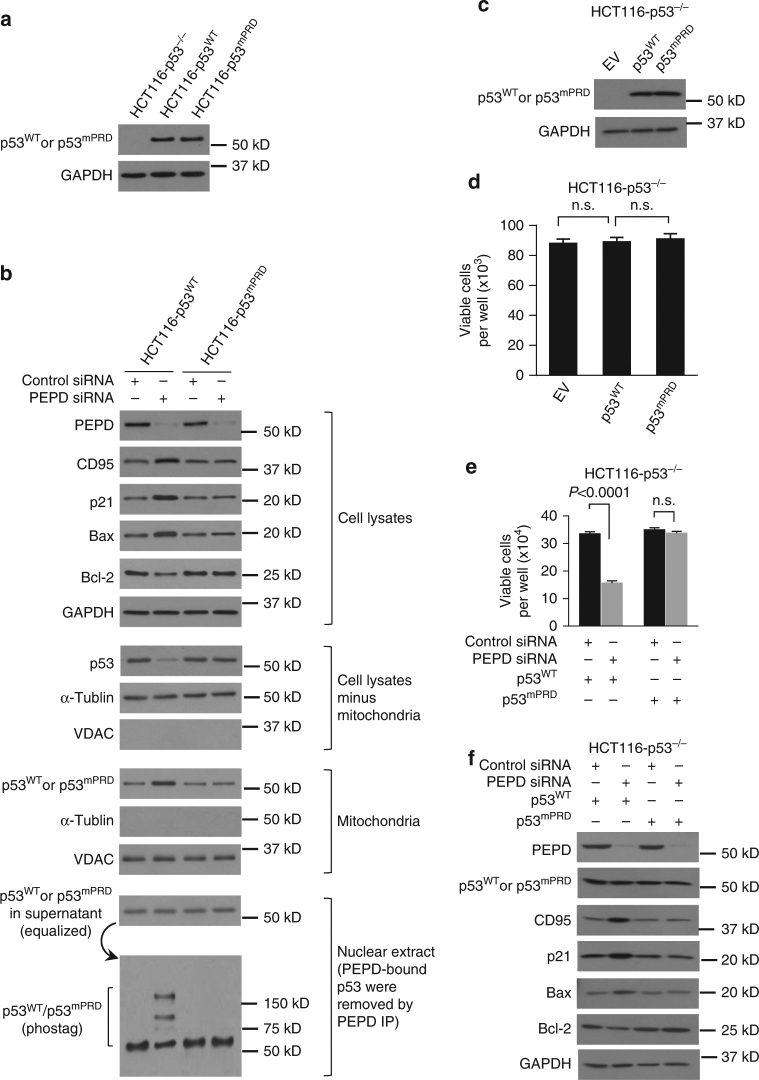
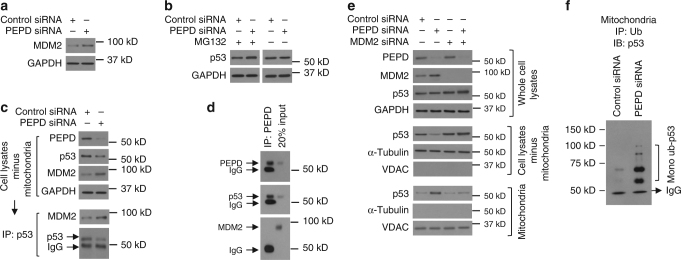
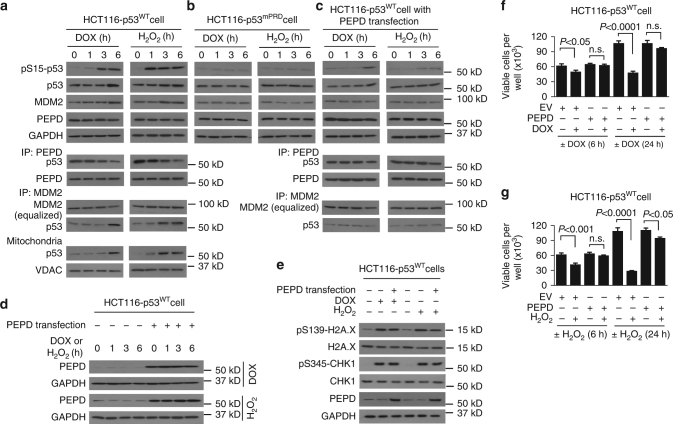
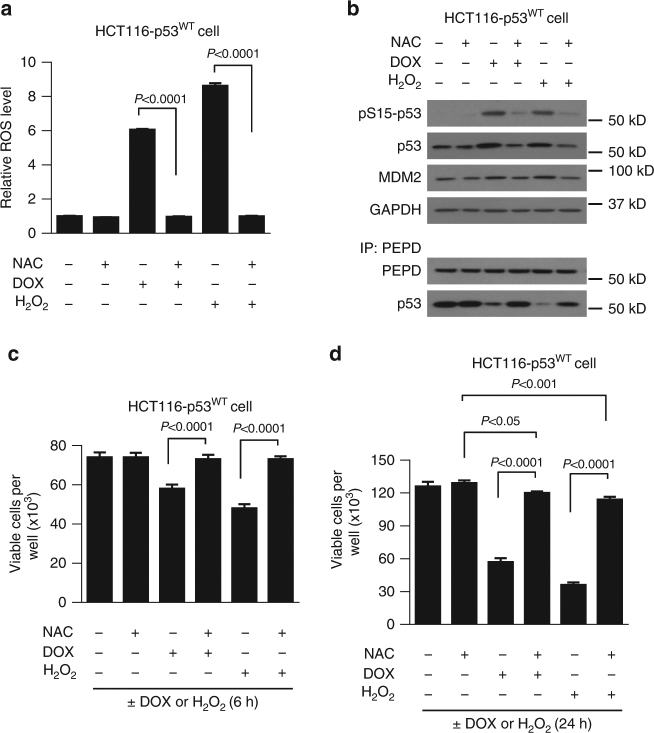
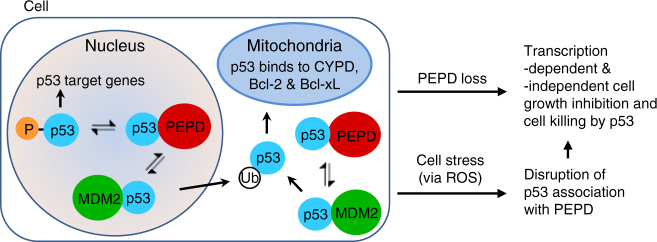
p53 tumor suppressor responds to various cellular stresses and regulates cell fate. Here, we show that peptidase D (PEPD) binds and suppresses over half of nuclear and cytoplasmic p53 under normal conditions, independent of its enzymatic activity. Eliminating PEPD causes cell death and tumor regression due to p53 activation. PEPD binds to the proline-rich domain in p53, which inhibits phosphorylation of nuclear p53 and MDM2-mediated mitochondrial translocation of nuclear and cytoplasmic p53. However, the PEPD-p53 complex is critical for p53 response to stress, as stress signals doxorubicin and H2O2 each must free p53 from PEPD in order to achieve robust p53 activation, which is mediated by reactive oxygen species. Thus, PEPD stores p53 for the stress response, but this also renders cells dependent on PEPD for survival, as it suppresses p53. This finding provides further understanding of p53 regulation and may have significant implications for the treatment of cancer and other diseases.


Conflict of interest statement

The authors declare no competing financial interests.

Figures

Fig. 1
Fig. 1
PEPD is essential for cell survival in vitro and in vivo. a Measurement of UM-UC-3 cell viability and IB analysis of PEPD after siRNA treatment. b Measurement of UM-UC-3 cell viability and IB analysis of PEPD after siRNA treatment for 24 h and then treatment with or without PEPD or PEPDG278D (His-tagged) for 48 h. c IB analysis of various proteins in UM-UC-3 cells after siRNA treatment. d UM-UC-3 cell cycle analysis by flow cytometry after siRNA treatment for 72 h. e, f UM-UC-3 tumor growth in athymic nude mice after intratumoral injection of control siRNA (open square) or PEPD siRNA (filled square) at the indicated times (arrows) and final tumor weight. g IB analysis of various proteins in tumors from 3 mice/group obtained on day 14. GAPDH and VDAC were measured to ensure the purity of subcellular fractions or as loading controls. Cells were cultured in 6-well plates (5 × 104 cells/well) for 24 h before experimental treatment in ad. Data are means ± s.d. (n = 3) in a, b, and d (two-way ANOVA followed by Tukey multiple comparisons test) and means ± s.e.m. (n = 8) in e and f (two-tailed t-test)
Fig. 2
Fig. 2
PEPD protects cells by suppressing p53. a, b IB analysis of various proteins and measurement of cell viability after siRNA treatment. cf Measurement of cell viability and IB analysis of proteins after treatment with siRNA in the absence or presence of pifithrin-α (30 μM) for 72 h. gi HCT116-p53−/− tumor growth in athymic nude mice after intratumoral injection of control siRNA or PEPD siRNA at the indicated times (arrows), final tumor weight, and IB analysis of various proteins in 3 tumors per group obtained on day 12. jl HCT116-p53+/+ tumor growth in athymic nude mice after intratumoral injection of control siRNA or PEPD siRNA at the indicated times (arrows), final tumor weight, and IB analysis of various proteins in 3 tumors per group obtained on day 9. Cells were grown in 12-well plates (2 × 104 cells/well) for 24 h before experimental treatment in af. Data are means ± s.d. (n = 3) in b, c and e (two-way ANOVA followed by Tukey multiple comparisons test) and means ± s.e.m. (n = 7–8) in g, h, j, and k (two-tailed t-test); n.s., not significant. GAPDH was used as a loading control in the IB experiments
Fig. 3
Fig. 3
PEPD inhibits transcription-independent p53 activity. a IB analysis of p53 relocation in cells after siRNA treatment for 72 h. Lamin A, α-tubulin and VDAC were measured to ensure the purity of the subcellular fractions or as loading controls. b IB analysis of p53 binding to CYPD in mitochondria after cell treatment with siRNA for 72 h. c IB analysis of Bcl-xL binding to p53, Bax and Bak in mitochondria after cell treatment with siRNA for 72 h. d Flow cytometry analysis of MMP after cell treatment with siRNA for 72 h. Cells were cultured in 6-well plates (5–10 × 104 cells/well) for 24 h before experimental treatment. Data are means ± s.d. (n = 3)
Fig. 4
Fig. 4
PEPD inhibits transcription function of p53. a Reporter activity in cells after plasmid transfection for 24 h and then treatment with siRNA for 48 h. b, c Phos-tag IB analysis and IB analysis of p53 phosphorylation in cells treated with siRNA for 72 h. d IB analysis of various proteins in nuclear fraction and cytosol of cells treated with siRNA for 72 h. Lamin A and GAPDH were measured as loading controls. Cells were cultured in 6-well plates (5–10 × 104 cells/well) for 24 h before experimental treatment. Data are means ± s.d. (n = 3) in a; two-way ANOVA followed by Tukey multiple comparisons test; n.s., not significant
Fig. 5
Fig. 5
PEPD binds to PRD in p53 and blocks nuclear p53 activation. a IP-IB analysis of direct binding of p53 and its mutants to PEPD. b IP-IB analysis of direct binding of PEPD and its mutants to p53. cf IP-IB analysis of percentages of cellular p53 that binds to PEPD and cellular PEPD that binds to p53. IB bands were quantified by ImageJ. Error bars are mean ± SD (n = 3). g IB analysis of PEPD and p53 and IP-IB analyses of PEPD-free p53 and phosphor-p53 in nuclear fraction of cells treated with siRNA for 72 h. Lamin A was measured as a loading control. Cells were cultured in 6-well plates (5–10 × 104 cells/well) for 24 h before siRNA treatment
Fig. 6
Fig. 6
PRD mutation inactivates p53. a IB analysis of p53WT and p53mPRD. b IB analysis of various proteins in whole lysates and subcellular fractions of cells treated with control siRNA or PEPD siRNA for 48 h. c, d IB analysis of p53WT and p53mPRD, as well as analysis of cell viability at 48 h after plasmid transfection. Cells were cultured in 24-well plates (5 × 103 cells/well) for 24 h before plasmid transfection. e, f Analysis of cell viability and IB analysis of various proteins in cells treated with siRNA for 48 h and then transfected with the plasmid for 48 h. GAPDH, α-tubulin and VDAC were measured to ensure the purity of the subcellular fractions or as loading controls. Cells were cultured in 6-well plates (8 × 103 cells/well) for 24 h before experimental treatment. Data are means ± s.d. (n = 3); one-way ANOVA followed by Tukey multiple comparisons test in d; two-way ANOVA followed by Tukey multiple comparisons test in e; n.s., not significant
Fig. 7
Fig. 7
PEPD blocks MDM2-mediated p53 move to mitochondria. a IB analysis of MDM2 in cells treated with siRNA for 72 h. b IB analysis of p53 in cells treated with siRNA and 24 h later treated with or without MG132 (25 μM) for 48 h. c IB and IP-IB analyses of p53 association with MDM2 after cell treatment with siRNA for 48 h. d IP-IB analysis of MDM2 binding to the p53-PEPD complex. e IB analysis of mitochondria translocation of p53 in cells treated first with control siRNA or MDM2 siRNA and 24 h later treated with control siRNA or PEPD siRNA for 48 h. MDM2 siRNA #1 was used (see Methods). f IB analysis of mitochondrial monoubiquitinated p53 in cells treated with siRNA for 48 h, with UbAl (100 μM) added in the final 4 h. GAPDH, α-tubulin and VDAC were measured to ensure the purity of subcellular fractions or as loading controls. Cells were cultured in 6-well plates (5–10 × 104 cells/well) for 24 h before experimental treatment
Fig. 8
Fig. 8
p53 activation by stress relies on p53 separation from PEPD. a IB and IP-IB analysis of various proteins in cell lysates and mitochondria after cell treatment with DOX or H2O2. b IB analysis of various proteins in cells treated with DOX or H2O2. c IB and IP-IB analysis of various proteins in cells transfected with PEPD for 24 h and then treated with DOX or H2O2. d IB analysis of PEPD in cell samples from a and c. e IB analysis of H2A.X, CHK1 and PEPD in control cells, cells treated with DOX or H2O2 for 6 h, or cells transfected with PEPD for 24 h and then treated with DOX or H2O2 for 6 h. f, g Measurement of cell viability. Cells were cultured in 12-well plates (2 × 104 cells/well) for 24 h, transfected with EV or PEPD, and 24 h later treated with DOX, H2O2 or solvent for 6 h or 24 h. Data are means ± s.d. (n = 3); two-way ANOVA followed by Tukey multiple comparisons test; n.s.; not significant. GAPDH and VDAC were measured as loading controls. DOX and H2O2 were used in all experiments at 400 nM and 400 μM, respectively
Fig. 9
Fig. 9
ROS is key to stress-induced p53 liberation from PEPD. a Relative ROS level in cells treated with solvent, DOX or H2O2 for 6 h, with or without NAC pretreatment for 3 h. b IB and IP-IB analysis of various proteins in cells treated with solvent, DOX or H2O2 for 6 h, with or without NAC pretreatment for 3 h. GAPDH was measured as a loading control. c, d Measurement of cell viability after treatment with DOX or H2O2 for 6 h or 24 h, with or without NAC pretreatment for 3 h. Data are means ± s.d. (n–3); two-way ANOVA followed by Tukey multiple comparisons test. In all experiments, cells were cultured in 12-well plates (4 × 104 cells/well) for 24 h before experimental treatment. DOX, H2O2 and NAC were used at 400 nM, 400 μM and 5 mM, respectively
Fig. 10
Fig. 10
Paradigm of p53 regulation by PEPD. PEPD binds to both nuclear and cytosolic p53. More than 50% of cellular p53 is sequestered by PEPD, rendering cells dependent on PEPD for survival and growth under normal circumstances, as eliminating PEPD activates p53, which leads to cell death. PEPD binds to nuclear p53 to inhibit its phosphorylation and transcription activity. PEPD competes with MDM2 for p53 binding, thereby inhibiting MDM2-dependent mitochondria translocation of nuclear and cytoplasmic p53, leading to inhibition of transcription-independent activity of p53. The PEPD-p53 complex is designed for rapid mobilization of pre-synthesized p53 in response to stress, which is mediated by ROS. Notably, MDM2 is known to promote p53 translocation to mitochondria by monoubiquitinating p53, to promote p53 degradation by polyubiquitinating p53, and to inhibit p53 transcription activity unrelated to ubiquitination. It is also known that the MDM2 gene is transcriptionally activated by p53

Similar articles

Cited by

References

    1. Bergmann M, Fruton JS. On proteolytic enzymes: XII. Regarding the specificity of aminopeptidase and carboxypeptidase. A new type of enzyme in the intestinal tract. J. Biol. Chem. 1937;117:189–202.
    1. Myara I, Charpentier C, Lemonnier A. Prolidase and prolidase deficiency. Life Sci. 1984;34:1985–1998. doi: 10.1016/0024-3205(84)90363-1. - DOI - PubMed
    1. Lupi A, et al. Human recombinant prolidase from eukaryotic and prokaryotic sources. Expression, purification, characterization and long-term stability studies. FEBS J. 2006;273:5466–5478. doi: 10.1111/j.1742-4658.2006.05538.x. - DOI - PubMed
    1. Surazynski A, et al. Extracellular matrix and HIF-1 signaling: the role of prolidase. Int. J. Cancer. 2008;122:1435–1440. doi: 10.1002/ijc.23263. - DOI - PubMed
    1. Surazynski A, Miltyk W, Palka J, Phang JM. Prolidase-dependent regulation of collagen biosynthesis. Amino Acids. 2008;35:731–738. doi: 10.1007/s00726-008-0051-8. - DOI - PubMed

Publication types

MeSH terms