

Tear proteome analysis in ocular surface diseases using label-free LC-MS/MS and multiplexed-microarray biomarker validation
- PMID: 29234088
- PMCID: PMC5727318
- DOI: 10.1038/s41598-017-17536-2
Tear proteome analysis in ocular surface diseases using label-free LC-MS/MS and multiplexed-microarray biomarker validation
Abstract
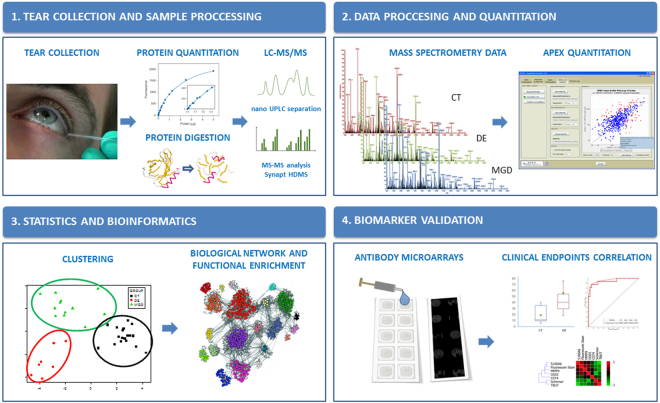
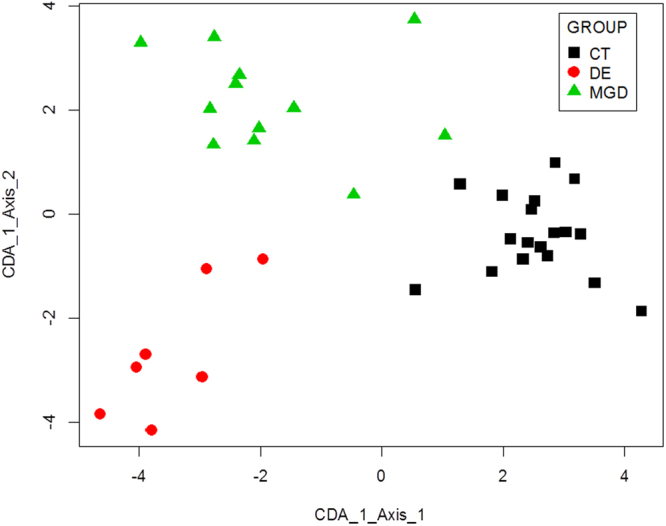
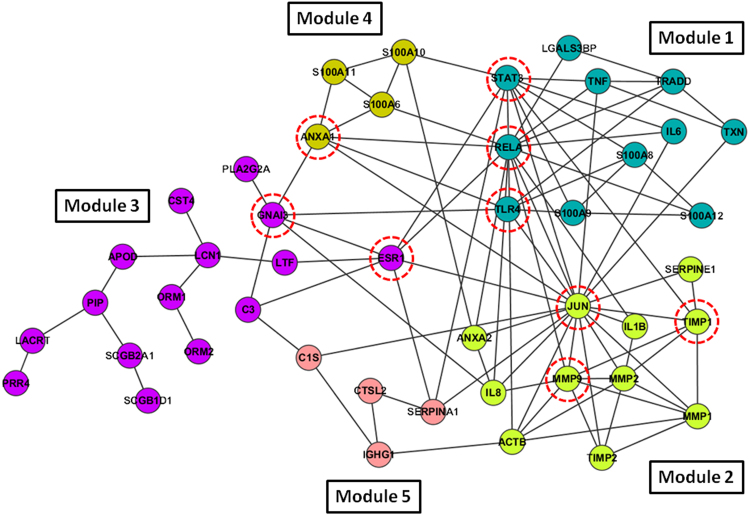
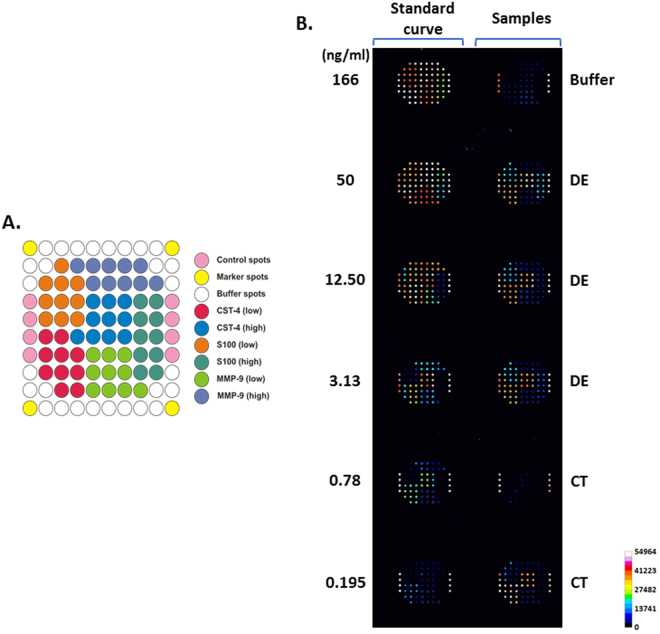
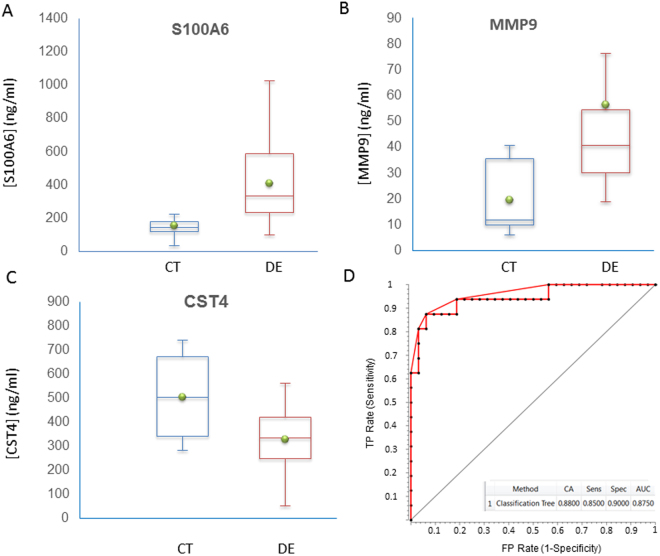
We analyzed the tear film proteome of patients with dry eye (DE), meibomian gland dysfunction (MGD), and normal volunteers (CT). Tear samples were collected from 70 individuals. Of these, 37 samples were analyzed using spectral-counting-based LC-MS/MS label-free quantitation, and 33 samples were evaluated in the validation of candidate biomarkers employing customized antibody microarray assays. Comparative analysis of tear protein profiles revealed differences in the expression levels of 26 proteins, including protein S100A6, annexin A1, cystatin-S, thioredoxin, phospholipase A2, antileukoproteinase, and lactoperoxidase. Antibody microarray validation of CST4, S100A6, and MMP9 confirmed the accuracy of previously reported ELISA assays, with an area under ROC curve (AUC) of 87.5%. Clinical endpoint analysis showed a good correlation between biomarker concentrations and clinical parameters. In conclusion, different sets of proteins differentiate between the groups. Apolipoprotein D, S100A6, S100A8, and ceruloplasmin discriminate best between the DE and CT groups. The differences between antileukoproteinase, phospholipase A2, and lactoperoxidase levels allow the distinction between MGD and DE, and the changes in the levels of annexin A1, clusterin, and alpha-1-acid glycoprotein 1, between MGD and CT groups. The functional network analysis revealed the main biological processes that should be examined to identify new candidate biomarkers and therapeutic targets.
Conflict of interest statement
The authors declare that the results reported in this work may be of commercial interest to Bioftalmik Applied Research.
Figures
Similar articles
-
Quantification of a panel for dry-eye protein biomarkers in tears: A comparative pilot study using standard ELISA and customized microarrays.Mol Vis. 2021 May 8;27:243-261. eCollection 2021. Mol Vis. 2021. PMID: 34012227 Free PMC article.
-
Tear proteome and protein network analyses reveal a novel pentamarker panel for tear film characterization in dry eye and meibomian gland dysfunction.J Proteomics. 2013 Jan 14;78:94-112. doi: 10.1016/j.jprot.2012.11.017. Epub 2012 Nov 29. J Proteomics. 2013. PMID: 23201116 Clinical Trial.
-
The analysis of human conjunctival epithelium proteome in ocular surface diseases using impression cytology and 2D-DIGE.Exp Eye Res. 2018 Feb;167:31-43. doi: 10.1016/j.exer.2017.03.006. Epub 2017 Mar 20. Exp Eye Res. 2018. PMID: 28336260
-
Improving awareness, identification, and management of meibomian gland dysfunction.Ophthalmology. 2012 Oct;119(10 Suppl):S1-12. doi: 10.1016/j.ophtha.2012.06.064. Ophthalmology. 2012. PMID: 23034341
-
Critical role of mass spectrometry proteomics in tear biomarker discovery for multifactorial ocular diseases (Review).Int J Mol Med. 2021 May;47(5):83. doi: 10.3892/ijmm.2021.4916. Epub 2021 Mar 24. Int J Mol Med. 2021. PMID: 33760148 Free PMC article. Review.
Cited by
-
Tear Samples for Protein Extraction: Comparative Analysis of Schirmer's Test Strip and Microcapillary Tube Methods.Cureus. 2023 Dec 22;15(12):e50972. doi: 10.7759/cureus.50972. eCollection 2023 Dec. Cureus. 2023. PMID: 38259376 Free PMC article.
-
Quantification of a panel for dry-eye protein biomarkers in tears: A comparative pilot study using standard ELISA and customized microarrays.Mol Vis. 2021 May 8;27:243-261. eCollection 2021. Mol Vis. 2021. PMID: 34012227 Free PMC article.
-
Applications of Tandem Mass Spectrometry (MS/MS) in Protein Analysis for Biomedical Research.Molecules. 2022 Apr 8;27(8):2411. doi: 10.3390/molecules27082411. Molecules. 2022. PMID: 35458608 Free PMC article. Review.
-
Altered mucins and aquaporins indicate dry eye outcome in patients undergoing Vitreo-retinal surgery.PLoS One. 2020 May 21;15(5):e0233517. doi: 10.1371/journal.pone.0233517. eCollection 2020. PLoS One. 2020. PMID: 32437405 Free PMC article.
-
Tear biomarkers in dry eye disease: Progress in the last decade.Indian J Ophthalmol. 2023 Apr;71(4):1190-1202. doi: 10.4103/IJO.IJO_2981_22. Indian J Ophthalmol. 2023. PMID: 37026250 Free PMC article. Review.
References
Publication types
MeSH terms
Substances
LinkOut - more resources
Full Text Sources
Other Literature Sources
Medical
Miscellaneous
