. 2018 Jan;120(1):13-24.
doi: 10.1038/s41437-017-0005-6. Epub 2017 Nov 8.

The IICR (inverse instantaneous coalescence rate) as a summary of genomic diversity: insights into demographic inference and model choice

Affiliations

The IICR (inverse instantaneous coalescence rate) as a summary of genomic diversity: insights into demographic inference and model choice

Lounès Chikhi et al. Heredity (Edinb). 2018 Jan.

Abstract

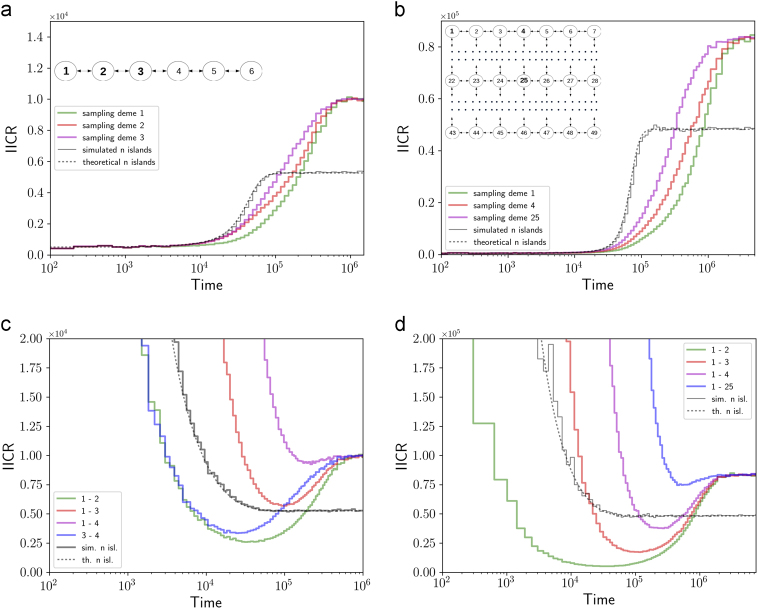
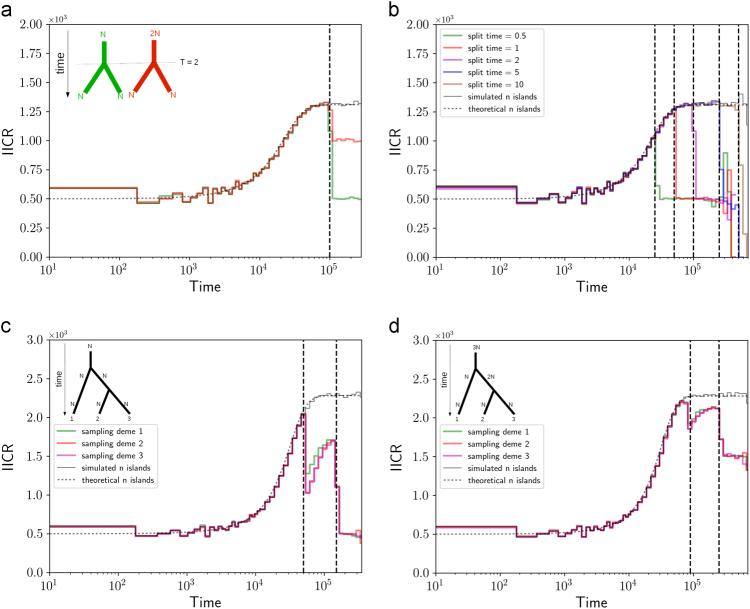
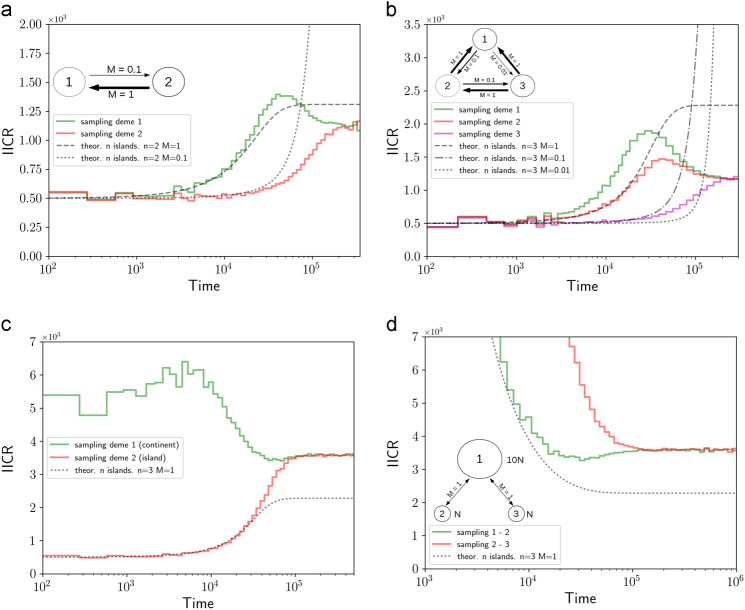
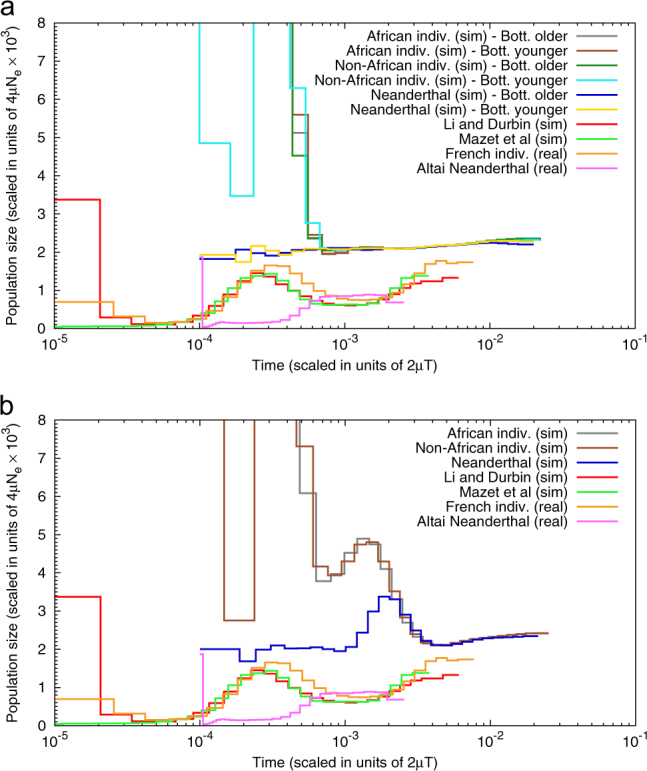
Several inferential methods using genomic data have been proposed to quantify and date population size changes in the history of species. At the same time an increasing number of studies have shown that population structure can generate spurious signals of population size change. Recently, Mazet et al. (2016) introduced, for a sample size of two, a time-dependent parameter, which they called the IICR (inverse instantaneous coalescence rate). The IICR is equivalent to a population size in panmictic models, but not necessarily in structured models. It is characterised by a temporal trajectory that suggests population size changes, as a function of the sampling scheme, even when the total population size was constant. Here, we extend the work of Mazet et al. (2016) by (i) showing how the IICR can be computed for any demographic model of interest, under the coalescent, (ii) applying this approach to models of population structure (1D and 2D stepping stone, split models, two- and three-island asymmetric gene flow, continent-island models), (iii) stressing the importance of the sampling strategy in generating different histories, (iv) arguing that IICR plots can be seen as summaries of genomic information that can thus be used for model choice or model exclusion (v) applying this approach to the question of admixture between humans and Neanderthals. Altogether these results are potentially important given that the widely used PSMC (pairwise sequentially Markovian coalescent) method of Li and Durbin (2011) estimates the IICR of the sample, not necessarily the history of the populations.


Conflict of interest statement

The authors declare no conflict of interest.

Figures

Fig. 1
Fig. 1
Inferred population size changes for 1D and 2D stepping stone models with constant size. In panels a, b the two genes were sampled in the same deme, whereas in panels c, d they were sampled in different demes. Panels a, c show the results for the 1D stepping stone, whereas panels b, d show the 2D stepping stone model results. For comparison we also plotted the results for a comparable n-island model (same number of islands and M = 1) in all panels, using the same simulation approach (black ragged solid line) together with the theoretical (exact) IICR (black continuous solid line). Panels a, b contain a simplified representation of the models. In addition each panel contains a legend for the coloured lines. For instance, in panel a the two genes were obtained in demes 1 (green line), 2 (red line) and 3 (magenta line)
Fig. 2
Fig. 2
IICR s for population split models. Inferred population size changes for population split models with one or two splitting events. In the four panels the two genes were sampled in the same deme. Panel a shows a model where one ancestral population of size 2N (red line) or N (green line) splits in two populations of size N at time T = 2. In panel b the ancestral population of size N splits in two populations of size N at different times. Panels c, d show a split with a three-island model and an ancestral population of size N (panel c) and 3N (panel d) at time T = 1 and 3. In all models the populations exchange genes at a rate M = 1 after the split. For comparison we also plotted the simulation and theoretical curves for a comparable n-island model (black lines)
Fig. 3
Fig. 3
IICR s for asymmetrical gene flow and continent-island models. In the first three panels the two genes were sampled in the same deme, whereas in panel d they were sampled in two different demes. Panels a, b show a model with two or three islands, respectively, that exchange genes at different rates (M 12 = 1, M 21 = 0.1, M 23 = 1, M 32 = 0.1, M 21 = 0.1, M 31 = 0.01 and M 13 = 1, where M ij is the number of haploid genomes in deme i that migrated in from deme j. Panel c shows the result for the continent-island model with a size ratio 1:10 (the continent is ten times larger than the island) and M = 1. For comparison we also plotted the simulation and theoretical results for a comparable n-island model in all panels, as in the other figures. For panels a, b we added the theoretical IICR for M = 0.1 and M = 0.01 since these are the rates of exchange between some of the demes
Fig. 4
Fig. 4
PSMC plots for the admixture and ancient structure models of Yang et al. (2012). This figure shows the PSMC plots for genomic data simulated under the models of admixture (panel a) and ancient population structure (panel b). The models of Yang et al. (2012) have three populations corresponding to Africans, non-Africans (Europeans or Asians) and Neanderthals. We obtained the PSMC plots for one individual from each of these populations, with parameter values used by the authors. Additional figures can be found in the Supplementary Materials. Here, we represent individuals simulated under the three main models, namely recent admixture with a bottleneck that is either (i) younger, or (ii) older than the admixure event and, (iii) ancient structure. In panel a the African, Non-African and Neanderthal individuals were simulated under the model of recent admixture with a bottleneck that was either older or younger than the admixture event. In panel b the PSMCs were obtained for an African, Non-African and Neanderthal individual simulated under the model of ancient structure. For the simulated Neanderthals the PSMC curves stop in the past at a time corresponding to the age of the real Neanderthal sample (pink line). The PSMC results obtained for the real genomic data of a French (human, isolated orange line) and a Neanderthal (unknown nationality, pink line) are represented for comparison. The red and light green lines that are on top of each other represent the PSMC plots based on the ms commands of Li and Durbin (2011) and Mazet et al. (2016), respectively

References

    1. Beaumont M. Recent developments in genetic data analysis: what can they tell us about human demographic history? Heredity. 2004;92(5):365–379. doi: 10.1038/sj.hdy.6800447. - DOI - PubMed
    1. Beaumont MA, Zhang W, Balding DJ. Approximate Bayesian computation in population genetics. Genetics. 2002;162(4):2025–2035. - PMC - PubMed
    1. Boitard S, Rodriguez W, Jay F, Mona S, Austerlitz F. Inferring population size history from large samples of genome-wide molecular data-an approximate bayesian computation approach. PLoS Genet. 2016;12(3):e1005877. doi: 10.1371/journal.pgen.1005877. - DOI - PMC - PubMed
    1. Chikhi L, Sousa VC, Luisi P, Goossens B, Beaumont MA. The confounding effects of population structure, genetic diversity and the sampling scheme on the detection and quantification of population size changes. Genetics. 2010;186(3):983–995. doi: 10.1534/genetics.110.118661. - DOI - PMC - PubMed
    1. Eriksson A, Manica A. Effect of ancient population structure on the degree of polymorphism shared between modern human populations and ancient hominins. Proc Natl Acad Sci. 2012;109(35):13956–13960. doi: 10.1073/pnas.1200567109. - DOI - PMC - PubMed

Publication types

LinkOut - more resources