. 2017 Nov 21:17:596-606.
doi: 10.1016/j.nicl.2017.11.017. eCollection 2018.

Exploring the multiple-hit hypothesis of preterm white matter damage using diffusion MRI

Affiliations

Exploring the multiple-hit hypothesis of preterm white matter damage using diffusion MRI

Madeleine L Barnett et al. Neuroimage Clin. .

Abstract

Background: Preterm infants are at high risk of diffuse white matter injury and adverse neurodevelopmental outcome. The multiple hit hypothesis suggests that the risk of white matter injury increases with cumulative exposure to multiple perinatal risk factors. Our aim was to test this hypothesis in a large cohort of preterm infants using diffusion weighted magnetic resonance imaging (dMRI).

Methods: We studied 491 infants (52% male) without focal destructive brain lesions born at < 34 weeks, who underwent structural and dMRI at a specialist Neonatal Imaging Centre. The median (range) gestational age (GA) at birth was 30+ 1 (23+ 2-33+ 5) weeks and median postmenstrual age at scan was 42+ 1 (38-45) weeks. dMRI data were analyzed using tract based spatial statistics and the relationship between dMRI measures in white matter and individual perinatal risk factors was assessed. We tested the hypothesis that increased exposure to perinatal risk factors was associated with lower fractional anisotropy (FA), and higher radial, axial and mean diffusivity (RD, AD, MD) in white matter. Neurodevelopmental performance was investigated using the Bayley Scales of Infant and Toddler Development, Third Edition (BSITD-III) in a subset of 381 infants at 20 months corrected age. We tested the hypothesis that lower FA and higher RD, AD and MD in white matter were associated with poorer neurodevelopmental performance.

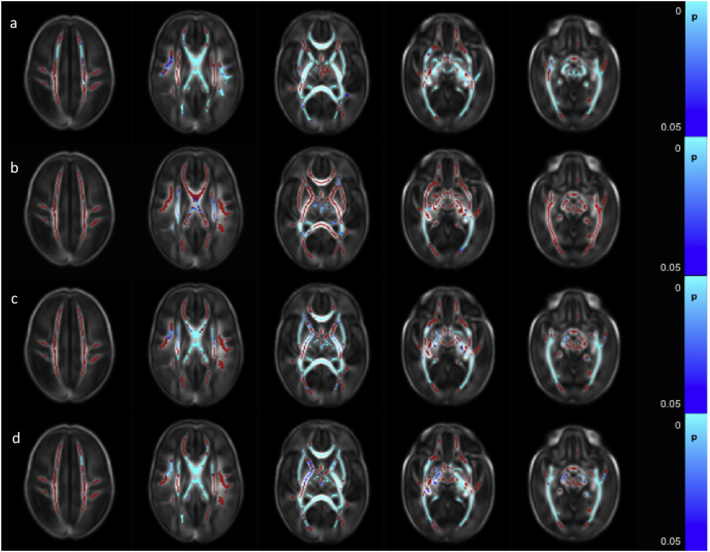
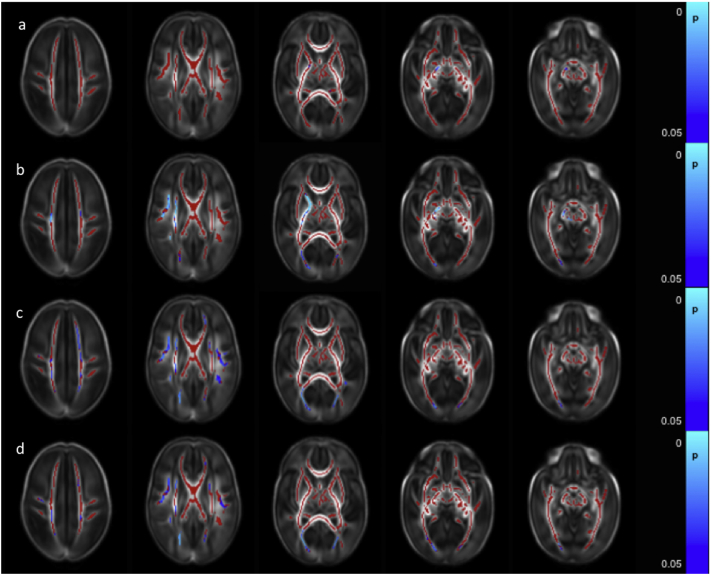
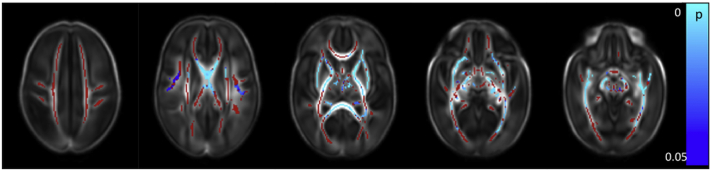
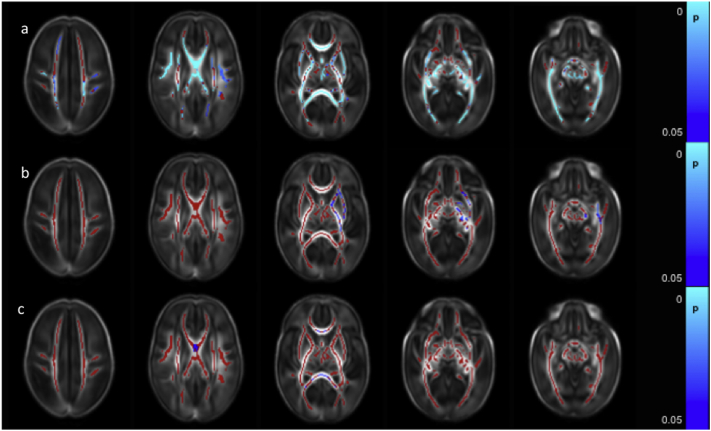
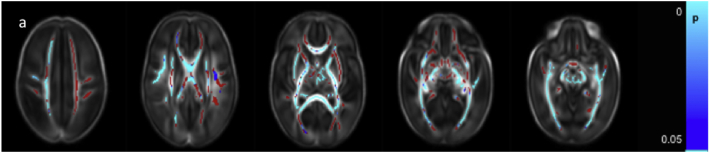
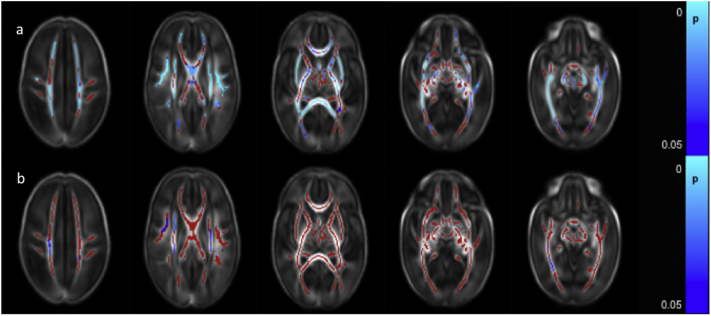
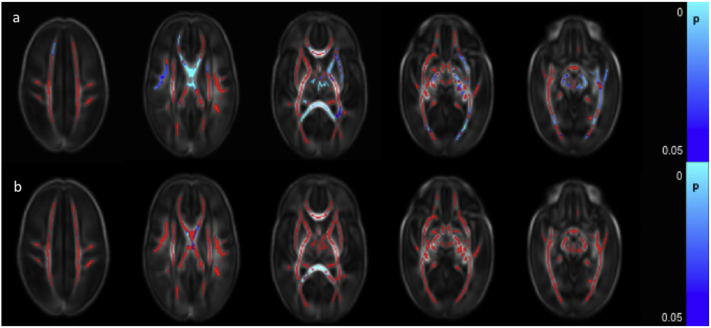
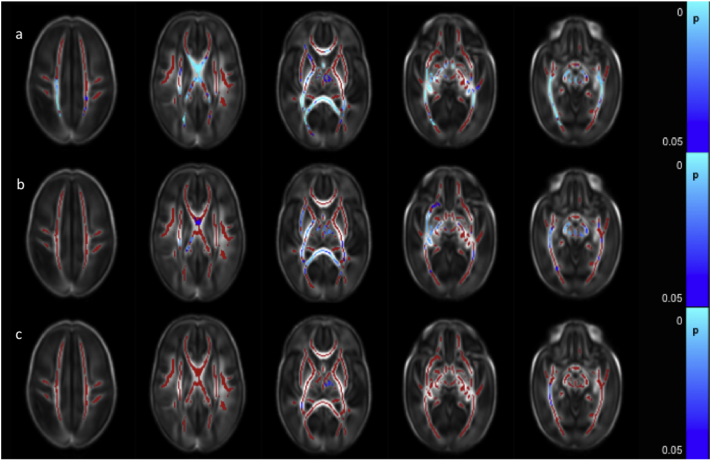
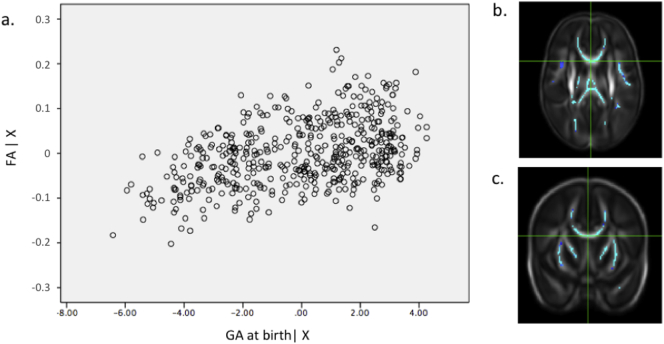
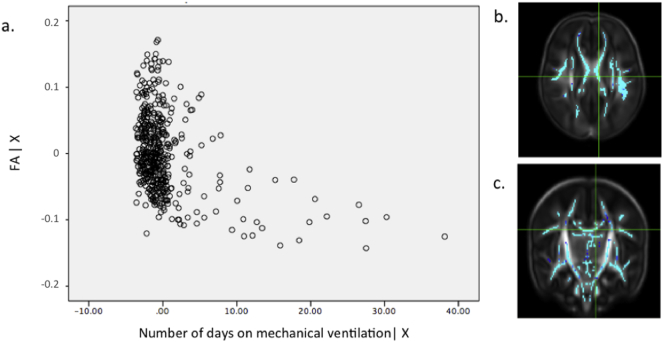
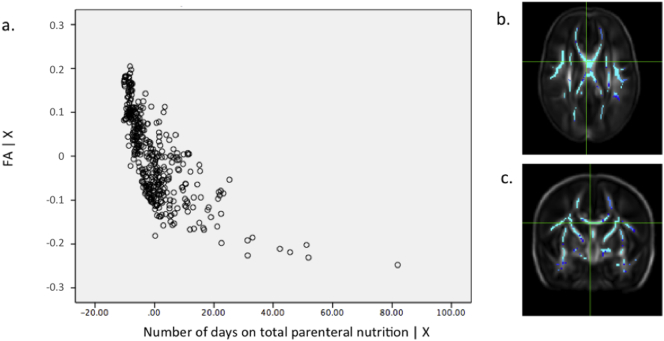
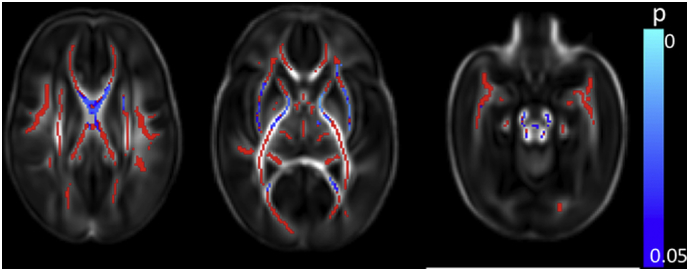
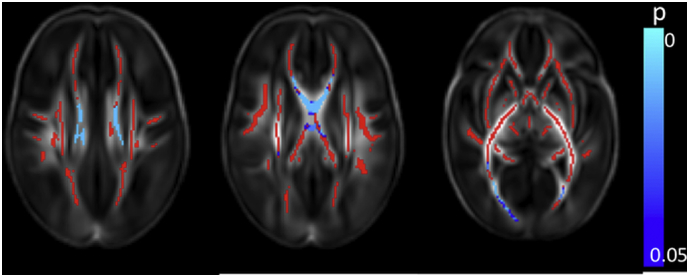
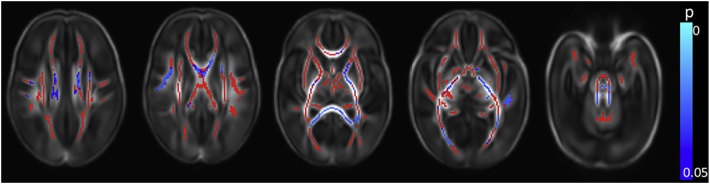
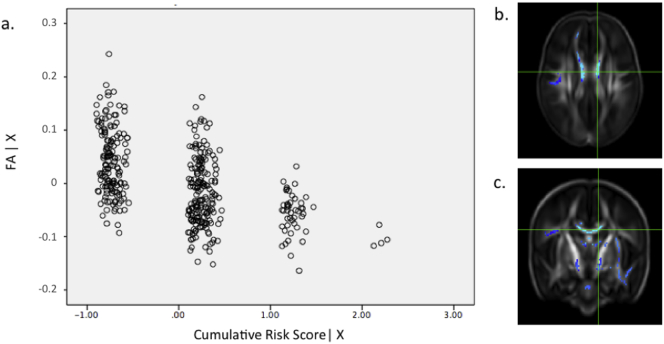
Results: Identified risk factors for diffuse white matter injury were lower GA at birth, fetal growth restriction, increased number of days requiring ventilation and parenteral nutrition, necrotizing enterocolitis and male sex. Clinical chorioamnionitis and patent ductus arteriosus were not associated with white matter injury. Multivariate analysis demonstrated that fetal growth restriction, increased number of days requiring ventilation and parenteral nutrition were independently associated with lower FA values. Exposure to cumulative risk factors was associated with reduced white matter FA and FA values at term equivalent age were associated with subsequent neurodevelopmental performance.

Conclusion: This study suggests multiple perinatal risk factors have an independent association with diffuse white matter injury at term equivalent age and exposure to multiple perinatal risk factors exacerbates dMRI defined, clinically significant white matter injury. Our findings support the multiple hit hypothesis for preterm white matter injury.

Keywords: ALIC, anterior limb of the internal capsule; BSITD-III, Bayley Scales of Infant and Toddler Development Third Edition; Brain; Development; Diffusion MRI; GA, gestational age; IMD, index of multiple deprivation; Multiple hit hypothesis; PLIC, posterior limb of the internal capsule; PMA, postmenstrual age; Prematurity; SLF, superior longitudinal fasciculus; dMRI, diffusion magnetic resonance imaging.


Figures

Fig. 1
Fig. 1
Correlation between gestational age at birth and dMRI measures in white matter. Mean FA skeleton (red) overlaid on mean FA map in the axial plane. Voxels showing a significant correlation (p < 0.05) between GA at birth and a. FA, b. AD c. MD, and d. RD are shown in blue-light blue. (For interpretation of the references to color in this figure legend, the reader is referred to the web version of this article.)
Fig. 2
Fig. 2
Difference in white matter dMRI measures between male and female infants. Mean FA skeleton (red) overlaid on mean FA map in the axial plane. Voxels showing significantly greater (p < 0.05) a. FA, b. AD c. MD, and d. RD in male infants compared to female infants are shown in blue-light blue. (For interpretation of the references to color in this figure legend, the reader is referred to the web version of this article.)
Fig. 3
Fig. 3
Lower FA values in the white matter in infants with fetal growth restriction. Mean FA skeleton (red) overlaid on mean FA map in axial plane. Voxels showing significant lower (p < 0.05) FA values in the white matter in infants with fetal growth restriction are shown in blue-light blue. (For interpretation of the references to color in this figure legend, the reader is referred to the web version of this article.)
Fig. 4
Fig. 4
Correlation between days requiring invasive ventilation and dMRI measures in white matter. Mean FA skeleton (red) overlaid on mean FA map in axial plane. Voxels showing a significant correlation (p < 0.05) between days of ventilation and a. FA, b. AD, and c. RD are shown in blue-light blue. (For interpretation of the references to color in this figure legend, the reader is referred to the web version of this article.)
Fig. 5
Fig. 5
Correlation between days requiring parenteral nutrition and dMRI measures in white matter. Mean FA skeleton (red) overlaid on mean FA map in the axial plane. Voxels showing a significant correlation (p < 0.05) between FA and days of parenteral nutrition with are shown in blue-light blue. (For interpretation of the references to color in this figure legend, the reader is referred to the web version of this article.)
Fig. 6
Fig. 6
Difference between dMRI measures in the white matter in infants who had or had not undergone surgery for necrotising enterocolitis. Mean FA skeleton (red) overlaid on mean FA map in axial plane. Voxels showing a significant difference (p < 0.05) between infants with and without necrotising enterocolitis in a. FA and b. RD are shown in blue-light blue. (For interpretation of the references to color in this figure legend, the reader is referred to the web version of this article.)
Fig. 7
Fig. 7
Relationship between cumulative risk factor score and dMRI white matter measures. Mean FA skeleton (red) overlaid on mean FA map in the axial plane. Voxels showing a significant linear correlation (p < 0.05) between cumulative perinatal risk factor score and a. FA and b. RD are shown in blue-light blue. (For interpretation of the references to color in this figure legend, the reader is referred to the web version of this article.)
Fig. 8
Fig. 8
Correlation between neurodevelopmental assessment scores and FA values in the white matter. Mean FA skeleton (red) overlaid on mean FA map in the axial plane. Voxels showing a significant correlation (p < 0.05) between FA and a. Cognitive Score, b. Motor Score and c. Language Score are shown in blue-light blue. (For interpretation of the references to color in this figure legend, the reader is referred to the web version of this article.)
Fig. s1
Fig. s1
(a) Partial regression plot showing the relationship between FA values and gestational age at birth in data extracted from the most significant voxel (r = 0.44) highlighted in the crosshairs in the axial (b) and coronal (c) plane. PMA at scan and gender were included as covariates in the model. Key: FA | X = residuals of FA given the model; GA at birth | X = residuals of gestational age at birth given the model.
Fig. s2
Fig. s2
(a) Partial regression plot showing the relationship between FA values and number of days requiring mechanical ventilation in data extracted from the most significant voxel (r = 0.398) highlighted in the crosshairs in the axial (b) and coronal (c) plane. GA at birth, PMA at scan and gender were included as covariates in the model. Key: FA | X = residuals of FA given the model; Number of days on mechanical ventilation | X = residuals of number of days on mechanical ventilation given the model.
Fig. s3
Fig. s3
(a) Partial regression plot showing the relationship between FA values and number of days requiring parenteral nutrition in data extracted from the most significant voxel (r = 0.748) highlighted in the crosshairs in the axial (b) and coronal (c) plane. GA at birth, PMA at scan and gender were included as covariates in the model. Key: FA | X = residuals of FA given the model; Number of days on total parenteral nutrition | X = residuals of days on total parenteral nutrition given the model.
Fig. s4
Fig. s4
Results of multivariate analysis demonstrating lower FA values in the white matter in infants with fetal growth restriction (necrotizing enterocolitis requiring surgery, days requiring invasive ventilatory support, days requiring parenteral nutrition, GA at birth, PMA at scan and gender were included as covariates in the model). Mean FA skeleton (red) overlaid on mean FA map in axial plane. Voxels showing significant lower (p < 0.05) FA values in the white matter in infants with fetal growth restriction are shown in blue-light blue.
Fig. s5
Fig. s5
Results of multivariate analysis demonstrating a significant correlation between days requiring invasive ventilation and FA values in white matter (fetal growth restriction, necrotizing enterocolitis requiring surgery, days requiring parenteral nutrition, GA at birth, PMA at scan and gender were included as covariates in the model). Mean FA skeleton (red) overlaid on mean FA map in axial plane. Voxels showing a significant correlation (p < 0.05) between days of ventilation and FA are shown in blue-light blue.
Fig. s6
Fig. s6
Results of multivariate analysis demonstrating a significant correlation between days requiring parenteral nutrition and dMRI measures in white matter (fetal growth restriction, necrotizing enterocolitis requiring surgery, days requiring invasive ventilatory support, GA at birth, PMA at scan and gender were included as covariates in the model). Mean FA skeleton (red) overlaid on mean FA map in the axial plane. Voxels showing a significant correlation (p < 0.05) between FA and days of parenteral nutrition with are shown in blue-light blue.
Fig. s7
Fig. s7
(a) Partial regression plot showing the relationship between FA values and cumulative risk score in data extracted from the most significant voxel (r = 0.558) highlighted in the crosshairs in the axial (b) and coronal (c) plane. GA at birth, PMA at scan and gender were included as covariates in the model. Key: FA | X = residuals of FA given the model; Cumulative risk score | X = residuals of cumulative risk score given the model.

References

    1. Ådén U., Favrais G., Plaisant F., Winerdal M., Felderhoff-Mueser U., Lampa J., Lelièvre V., Gressens P. Systemic inflammation sensitizes the neonatal brain to excitotoxicity through a pro-/anti-inflammatory imbalance: key role of TNFalpha pathway and protection by etanercept. Brain Behav. Immun. 2010;24:747–758. - PubMed
    1. Ajayi-Obe M., Saeed N., Cowan F.M., Rutherford M.A., Edwards A.D. Reduced development of cerebral cortex in extremely preterm infants. Lancet. 2000;356:1162–1163. - PubMed
    1. Al-Asmakh M., Anuar F., Zadjali F., Rafter J., Pettersson S. Gut microbial communities modulating brain development and function. Gut Microbes. 2012 - PMC - PubMed
    1. Allen J.S., Damasio H., Grabowski T.J., Bruss J., Zhang W. Sexual dimorphism and asymmetries in the gray-white composition of the human cerebrum. NeuroImage. 2003;18:880–894. - PubMed
    1. Anblagan D., Pataky R., Evans M.J., Telford E.J., Serag A., Sparrow S., Piyasena C., Semple S.I., Wilkinson A.G., Bastin M.E., Boardman J.P. Association between preterm brain injury and exposure to chorioamnionitis during fetal life. Sci. Rep. 2016;6 - PMC - PubMed

LinkOut - more resources