. 2017 Dec 13;8(1):2109.
doi: 10.1038/s41467-017-00686-2.

In situ functional dissection of RNA cis-regulatory elements by multiplex CRISPR-Cas9 genome engineering

Affiliations

In situ functional dissection of RNA cis-regulatory elements by multiplex CRISPR-Cas9 genome engineering

Qianxin Wu et al. Nat Commun. .

Abstract

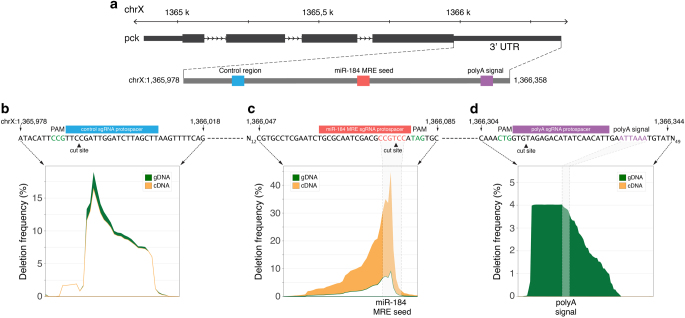
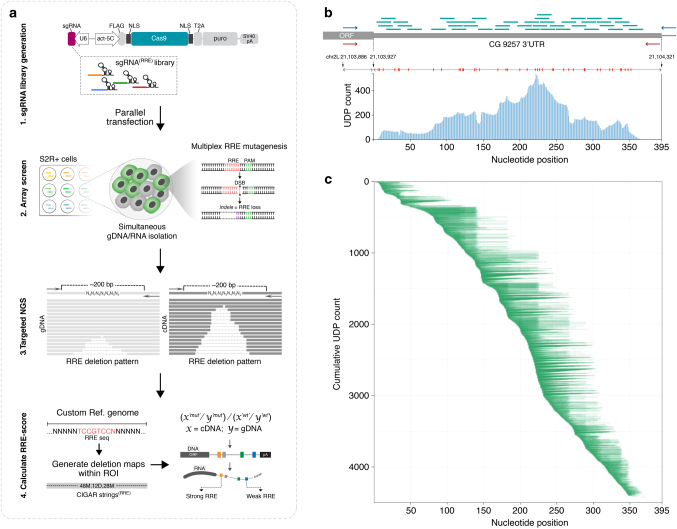
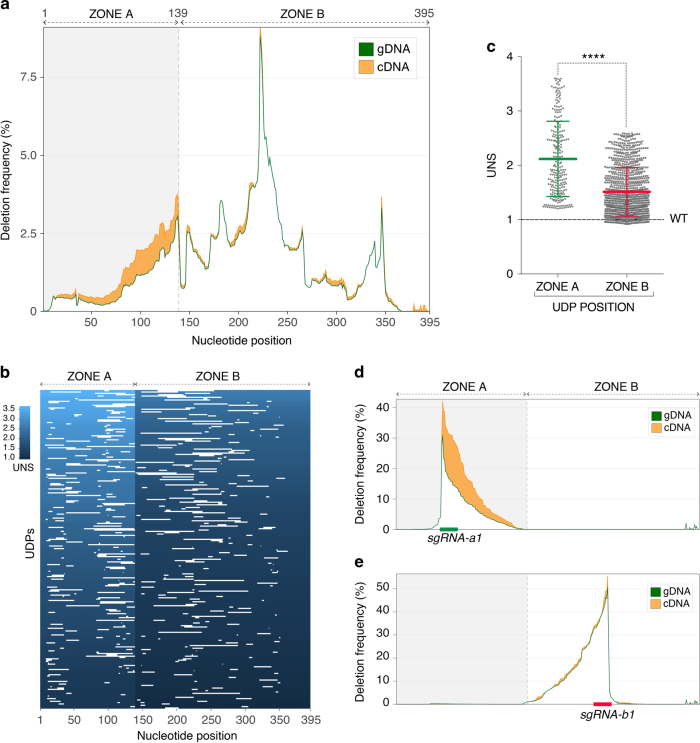
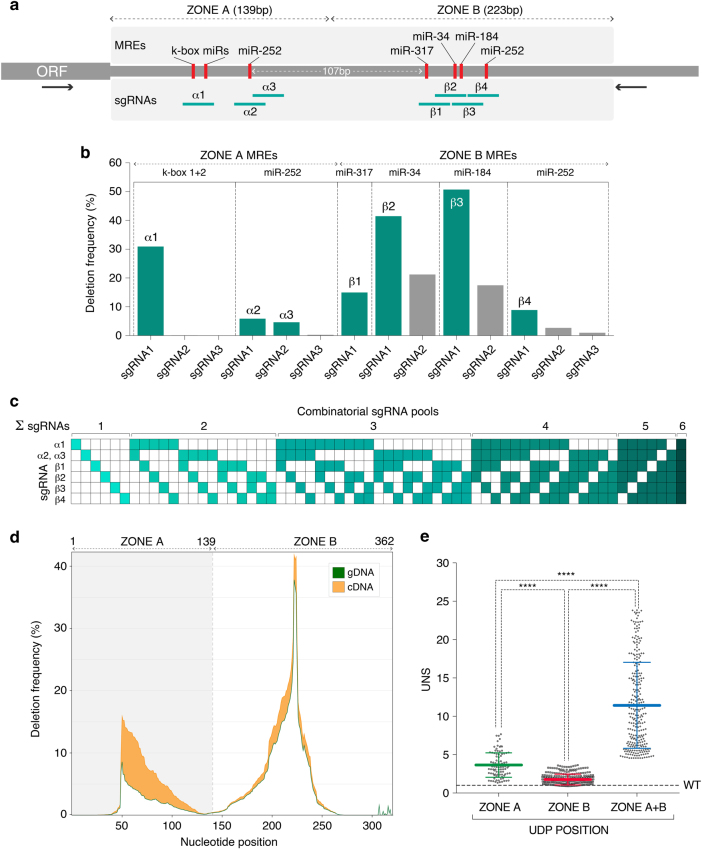
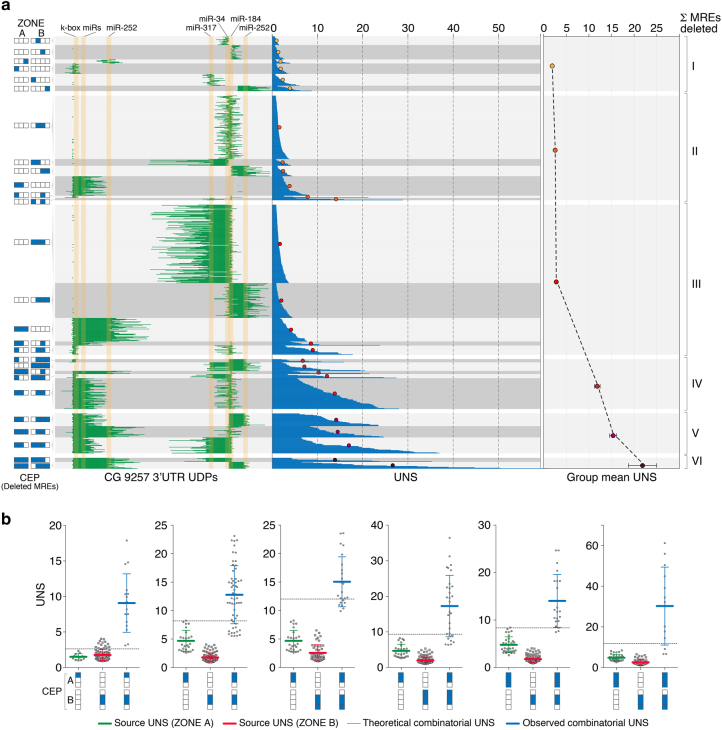
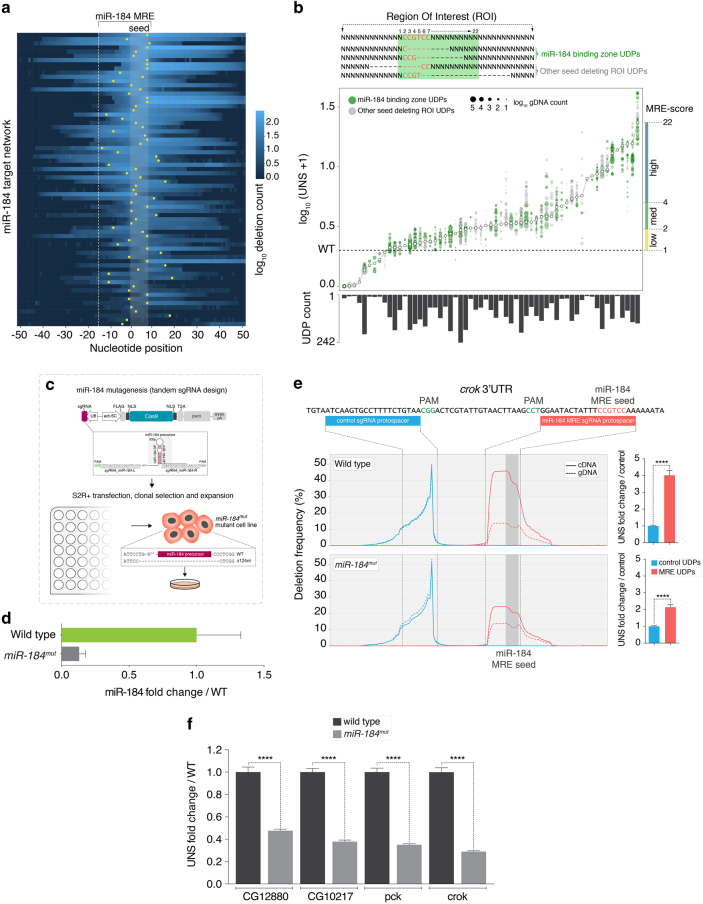
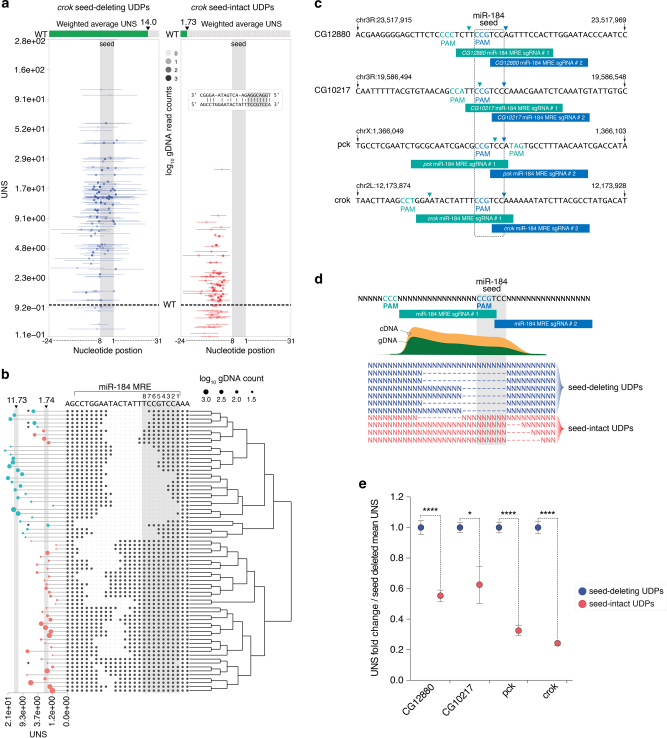
RNA regulatory elements (RREs) are an important yet relatively under-explored facet of gene regulation. Deciphering the prevalence and functional impact of this post-transcriptional control layer requires technologies for disrupting RREs without perturbing cellular homeostasis. Here we describe genome-engineering based evaluation of RNA regulatory element activity (GenERA), a clustered regularly interspaced short palindromic repeats (CRISPR)-Cas9 platform for in situ high-content functional analysis of RREs. We use GenERA to survey the entire regulatory landscape of a 3'UTR, and apply it in a multiplex fashion to analyse combinatorial interactions between sets of miRNA response elements (MREs), providing strong evidence for cooperative activity. We also employ this technology to probe the functionality of an entire MRE network under cellular homeostasis, and show that high-resolution analysis of the GenERA dataset can be used to extract functional features of MREs. This study provides a genome editing-based multiplex strategy for direct functional interrogation of RNA cis-regulatory elements in a native cellular environment.


Conflict of interest statement

T.A.M. is one of the founding shareholders of Oxstem Oncology (OSO), a subsidiary company of OxStem Ltd. J.-S.K. is a co-founder and shareholder of ToolGen, Inc., a biotechnology company focused on genome editing. The remaining authors declare no competing financial interests.

Figures

Fig. 1
Fig. 1
Experimental proof of concept for GenERA analysis. a pck genomic locus showing the 3′UTR relative coordinates of a control region, the predicted miR-184 MRE and the polyA signal. bd Analysis of CRISPR-based mutagenesis results at each target region described in a. For each genomic locus, the identity of the PAM (green), Cas9-mediated DNA double stranded cut site (arrow head) and sgRNA protospacer target sequence (blue, red and purple boxes) are shown along the corresponding sequences within the pck 3′UTR. Differential analysis of nucleotide deletion profiles reflects negligible differences in cDNA/gDNA mutant read frequencies at the control region (b), a substantial enrichment of cDNA sequencing reads containing deletions in the miR-184 MRE seed (c), and a complete absence of cDNA reads with missing polyA signals (d). The percentage of deleted reads in cDNA and gDNA are shown in orange and green respectively; the position of predicted miR-184 MRE seed sequence and polyA signal are highlighted by shaded areas
Fig. 2
Fig. 2
GenERA-based high-content mutagenesis of a candidate 3′UTR. a Design and implementation of experimental steps underlying GenERA-based parallel functional interrogation of RNA regulatory elements. b Genomic coordinates of CG9257 3′UTR showing the position and distribution of protospacers corresponding to all sgRNAs used to target this region (green). Red bars show the position of SpCas9 cut site for each sgRNA in the library. The relative locations of gDNA and cDNA NGS library primers are indicated by blue and red arrows respectively. Blue histogram reflects the total number of UDPs covering each individual nucleotide across the targeted region. c Coverage and distribution of all UDPs sorted by the position of the first deleted nucleotide and length of deletion. The position of nucleotides across the CG9257 3′UTR is shown on the x axis and the cumulative unique deletions count on the y axis
Fig. 3
Fig. 3
Unbiased surveillance of 3′UTR cis-regulatory potential with GenERA. a Analysis of nucleotide deletion frequencies in cDNA (orange) and gDNA (green) across the CG9257 3′UTR shows robust regulatory activity in region proximal to the open reading frame (ORF) (Zone A) and marginal activity in the rest of the UTR (Zone B). b Distribution of Zone A and Zone B UDPs (white lines) and their corresponding UNS values (blue gradient). The same number of UDPs was randomly sampled for both zones. c Comparative analysis of all UNS values (first to last quartiles) reflects significantly higher destabilising regulatory activity in Zone A compared to Zone B (n = 259 for zone A, n = 1003 for zone B, error bars = mean+/− SD, Mann-Whitney test, ****P < 0.0001). d, e Validation of observed differential regulatory potential associated with Zone A and Zone B. Peaks represent gDNA (green) and cDNA (orange) nucleotide deletion frequencies generated using individual sgRNAs designed to target Zone A (d) and Zone B (e). The precise positions of the sgRNA protospacers for Zone A (sgRNA-a1, green) and Zone B (sgRNA-b1, red) are displayed on the x axis
Fig. 4
Fig. 4
Implementation of GenERA for combinatorial RRE analysis. a CG9257 3′UTR displaying the boundaries of Zone A and Zone B, identity and position of all predicted MREs (red; low stringency miRanda target prediction algorithm), final sgRNAs designed to target each MRE (green), and gDNA/cDNA NGS library primers (black arrows). b The efficiency of all sgRNAs was tested by NGS and represented as percentage of reads containing deletions in the gDNA library (y axis). Final sgRNAs (green) were selected based on their efficiency and position relative to the seven predicted MREs. Since sgRNAs α2 and α3 which targeted zone A miR-252 MRE had relatively low efficiencies (5.8 and 4.6% respectively), they were delivered together in all combinatorial pools in order to increase the chance of generating miR-252 MRE deletions. c sgRNA multiplex strategy. All possible individual and combinatorial sgRNA pools (n = 63) were delivered to cells in an arrayed format. Green squares illustrate sgRNA identity in each given pool. Since sgRNAs α2 and α3 only targeted one MRE (Zone A miR-252) and had relatively low efficiencies (a), they were delivered together in all combinatorial pools in order to increase the chance of generating miR-252 MRE deletions. d Analysis of nucleotide deletion frequencies in cDNA (orange) and gDNA (green) generated by all combinatorial sgRNA pools in c reveals the regulatory activities associated with Zone A and Zone B. e Distribution of UNS values (first to last quartiles) calculated for all UDPs that overlap with Zone A (green), Zone B (red) and those concomitantly associated with Zone A and B (blue) (n = 93 for Zone A, n = 300 for Zone B, n = 272 for Zone A + B, error bars =  + / − SD, Mann-Whitney test, ****P < 0.0001)
Fig. 5
Fig. 5
Multiplex GenERA uncovers cooperative regulatory activities between putative MREs. a Summary of MRE combinatorial UDP analysis. The blue/white box code on the far left displays all combinatorial editing patterns (CEPs) that passed a minimum UDP count filter (> 10 UDPs) and were included in the analysis (blue = MRE deleted; white = MRE intact). Green lines reflect the identity of each UDP associated with a corresponding CEP. Yellow shaded areas indicate the position of the seven predicted MRE seed sequences. UNS values were calculated for each UDP (blue histogram, first to last quartiles) and used to derive an average UNS value for each CEP (coloured dots). All CEPs were finally clustered based on the number of total deleted MREs (1–6) and a mean UNS value was calculated for each group (right panel, error bars = SEM). b Analysis of MRE cooperative activity. Scatter plots represent UNS values (first to last quartiles) of different Zone A (green) or Zone B (red) source CEPs, their corresponding theoretical combinatorial UNS (dashed line), and the observed combinatorial UNS (blue). Each individual datapoint represents an experimentally determined UNS value. In all cases analysed, the observed combinatorial UNSs are significantly higher than the predicted values suggesting the presence of cooperative interactions between Zone A and Zone B MREs (Error bars = +/− SD, Mann-Whitney test, ****P < 0.0001)
Fig. 6
Fig. 6
GenERA-based analysis of a predicted MRE network activity. a UDP repertoire (blue gradient = number of UDPs overlapping a given nucleotide) across the miR-184 target network. Boundaries of the predicted miR-184 binding zone (dashed line), extended seed region (shaded area), and Cas9 DNA double stranded break sites (yellow dots) are highlighted. b Spatial distribution of seed-deleting UDPs selected for MRE-score calculation (top). UDPs restricted to the miRNA binding zone (green nt. 1–22) and extending to the full ROI (gray) were considered in the analysis. Ranked MRE-score distribution across the miR-184 MRE network (white dots) (bottom). Underlying UNS values (first to last quartiles) are shown with their sequencing depth (dot size) and spatial distribution (green and gray). Bar plot reflects total UDP counts contributing to each MRE-score calculation. Right y axis shows partitions in high, medium, and low MRE-score groups based on the empirical distribution of the data. c Generation of miR-184 mut cell line by CRISPR-Cas9 genome editing. d Quantification of mature miR-184 levels by RT-qPCR in wild type cells and miR-184 mut cells (n = 3 for each group, error bar = SEM). e Validation of GenERA data. Analysis of crok cDNA and gDNA deletion frequency profiles in wild type and miR-184 mut cells at a control locus (blue) compared to the predicted miR-184 MRE locus (red) (left plots). Quantification of UNS fold change from MRE UDPs normalized to control UDPs in wild type and miR-184 mut cells (right bar graphs, Error bar = SEM, Mann-Whitney test, ****P < 0.0001). f Comparative GenERA analysis of four top-ranking miR-184 MREs reveals a significant fold change difference between wild type and miR-184 mut cells, demonstrating dependence of the observed effects on miR-184 mediated regulation (Error bar = SEM, Mann-Whitney test, ****P < 0.0001)
Fig. 7
Fig. 7
Functional dissection of MRE sequence determinants. a Mapping of the complete UDP repertoire across the crok ROI (beginning and end coordinates of the deletion peaks) shows deletions patterns (x axis, line = UDP span, dot = center), UNS (y axis) and sequencing depth (transparency). UDPs are partitioned relative to their coverage of the extended seed region (blue = seed deletion; red = seed intact). UNS values for the ‘seed deletion’ group are significantly higher than the ‘seed intact’ group (t-test, P < 0.0001). Top meter indicates average UNS values for each group weighted by UDP sequencing depth (green). b High resolution analysis of crok UDP sets restricted to the miR-184 MRE region (nt. 1–22). Dendrogram showing hierarchical clustering of UDPs based on their deletion footprint (dashed line) is displayed along with corresponding UNS values (circle and lines horizontal plot). Scores are scaled by sequencing depth (size of circle) and coloured depending on UDP coverage of the extended seed region (teal = seed deletion; red orange = seed intact; * = UDP affecting only seed distal nucleotides). ce Analysis of sequence determinants underlying top ranking MREs from GenERA screen. To increase UDP complexity at each targeted locus, a second batch of sgRNAs was designed (blue) in addition to the ones used for the GenERA screen (green) (c). The identity of each protospacer (box), Cas9 cut site (arrow head) and PAM sequence are shown. d Diagrammatic representation of the computational approach used to demultiplex the ensuing UDP repertoire into seed-deleting (dark blue) and seed-intact (red) classes. e Seed-intact UDPs consistently generate lower UNS values compared to seed-deleting UDPs (Error bar = SEM, Mann-Whitney test, ****P < 0.0001, *P < 0.05)

References

    1. Schoenberg DR, Maquat LE. Regulation of cytoplasmic mRNA decay. Nat. Rev. Genet. 2012;13:246–259. doi: 10.1038/nrg3254. - DOI - PMC - PubMed
    1. Keene JD. RNA regulons: coordination of post-transcriptional events. Nat. Rev. Genet. 2007;8:533–543. doi: 10.1038/nrg2111. - DOI - PubMed
    1. Cook KB, Kazan H, Zuberi K, Morris Q, Hughes TR. RBPDB: a database of RNA-binding specificities. Nucleic. Acids. Res. 2011;39:D301–D308. doi: 10.1093/nar/gkq1069. - DOI - PMC - PubMed
    1. Zhao W, et al. Massively parallel functional annotation of 3′ untranslated regions. Nat. Biotechnol. 2014;32:387–391. doi: 10.1038/nbt.2851. - DOI - PMC - PubMed
    1. Oikonomou P, Goodarzi H, Tavazoie S. Systematic identification of regulatory elements in conserved 3′ UTRs of human transcripts. Cell reports. 2014;7:281–292. doi: 10.1016/j.celrep.2014.03.001. - DOI - PMC - PubMed

Publication types

MeSH terms