. 2017 Dec 13;7(1):17487.
doi: 10.1038/s41598-017-17832-x.

Leveraging ectopic Hsp90 expression to assay the presence of tumor cells and aggressive tumor phenotypes in breast specimens

Affiliations

Leveraging ectopic Hsp90 expression to assay the presence of tumor cells and aggressive tumor phenotypes in breast specimens

Brian Crouch et al. Sci Rep. .

Abstract

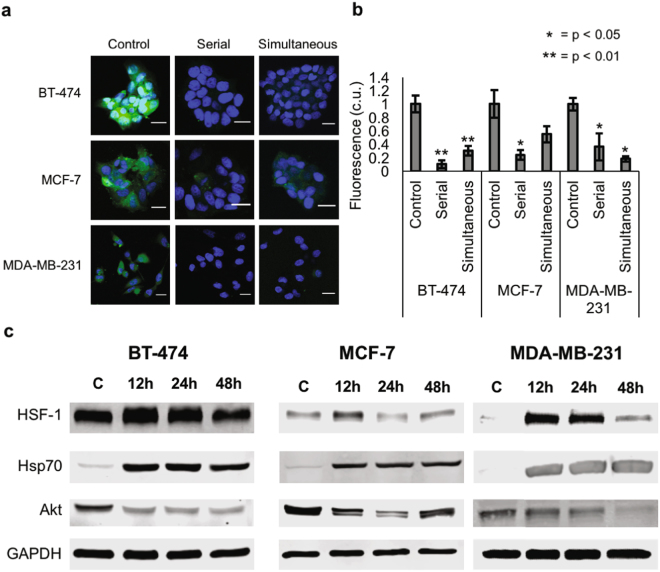
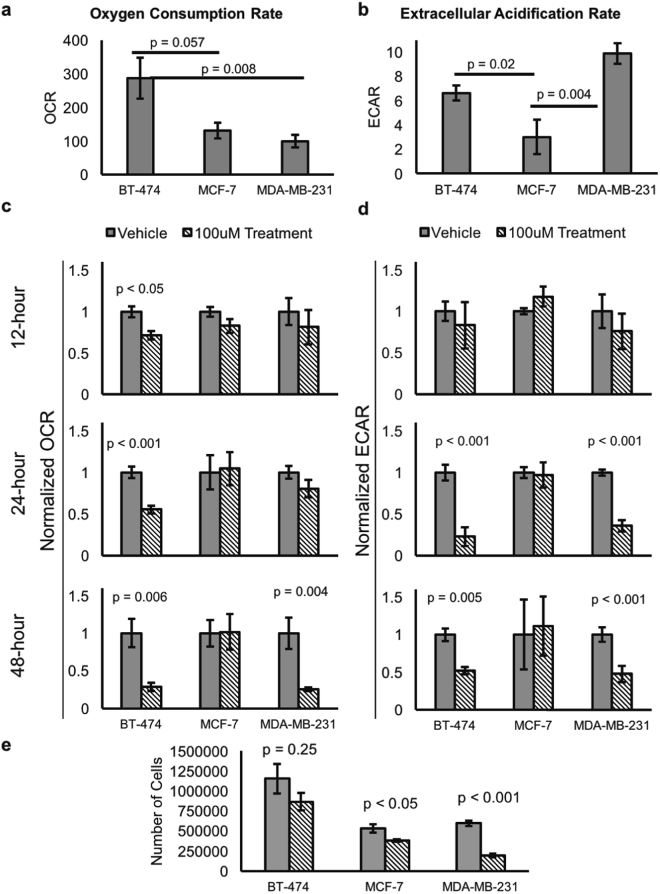
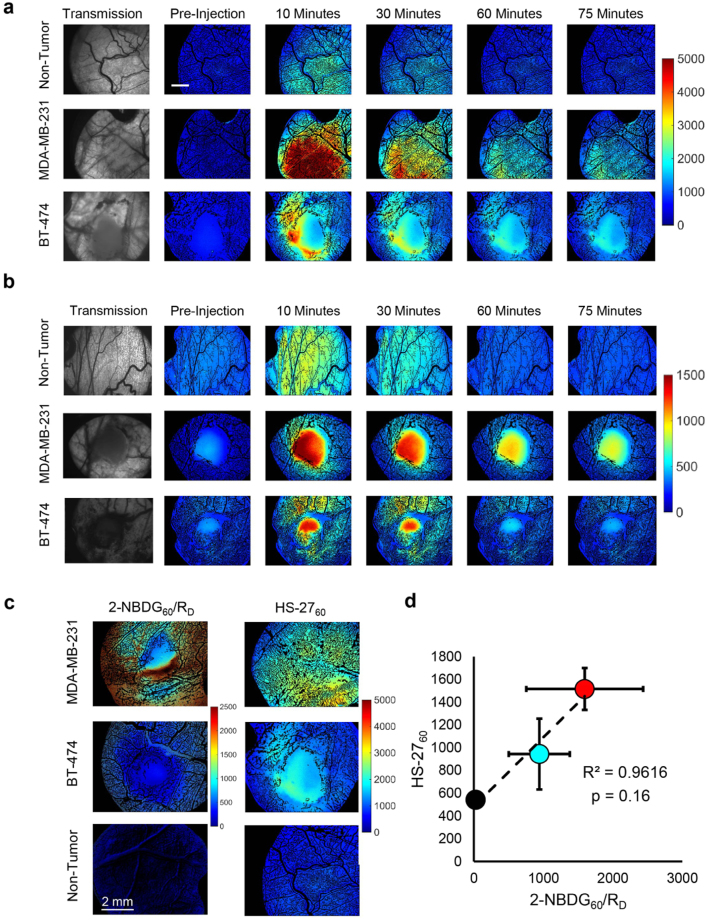
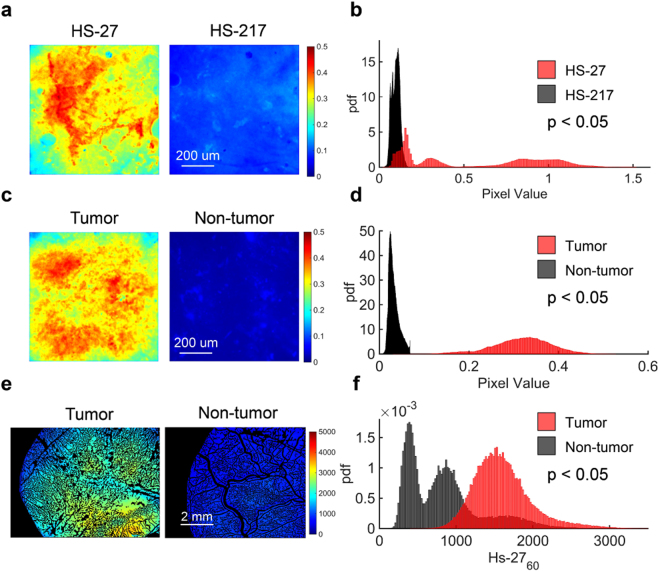
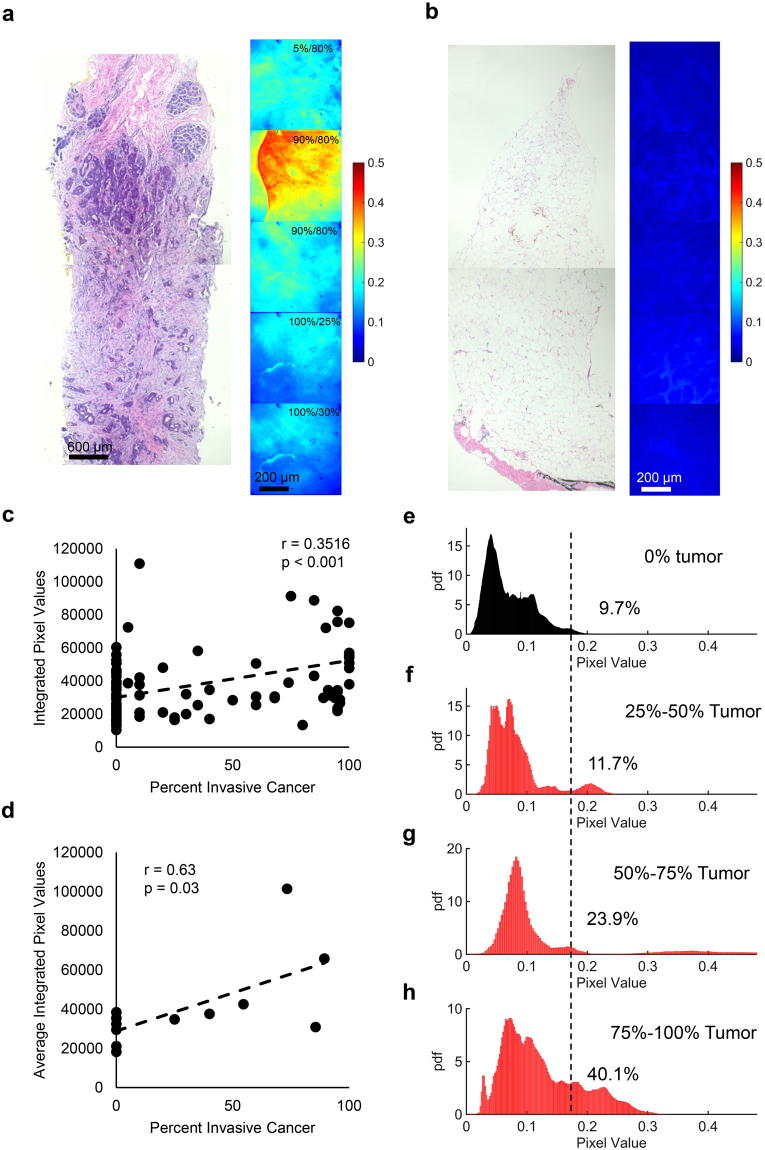
Hsp90 has been studied extensively as a therapeutic target in breast cancer in pre-clinical and clinical trials, demonstrating a variety of roles in metastatic progression. The evidence to date suggests a compelling opportunity to leverage attributes of Hsp90 expression beyond therapeutics with potential applications in breast cancer diagnosis, prognosis, and recurrence risk assessment. In this study, we developed a completely non-destructive strategy using HS-27, a fluorescently-tethered Hsp90 inhibitor, to assay Hsp90 expression on intact tissue specimens with comparable contrast to in vivo administration routes, and demonstrate the feasibility of our approach in breast cancer patients. In addition to Hsp90 inhibition being most effective in glycolytic tumors, we found ectopic Hsp90 expression to be highest in glycolytic tumors reinforcing its role as an indicator of aggressive disease. This work sets the stage for immediately using Hsp90 to improve outcomes for breast cancer patients without affecting traditional care pathways.


Conflict of interest statement

Dr. Ramanujam has founded a company called Zenalux Biomedical and she and other team members have developed technologies related to this work where the investigators or Duke may benefit financially if this system is sold commercially.

Figures

Figure 1
Figure 1
Hsp90 is expressed on the cell surface of breast cancer cells. (a and b) BT-474 (Her2-overexpressing), MCF-7 (ER + , PR + ), and MDA-MB-231 (triple negative) breast cancer cells were stained with 100 µM HS-27 only for 15 minutes (green, control), serially with 100 µM HS-10 for 14 minutes followed by 100 µM HS-27 for 15 minutes (serial), or simultaneously with 100 µM HS-10 and 100 µM HS-27 (simultaneous) for 15 minutes. DNA is stained in blue with Hoechst 33342. Scale bars are 20 µm. Fluorescence was normalized so that the control images had a value of 1. For all experiments, the sample size was n = 3 per group, and p-values were determined using one-way ANOVA followed by Tukey-Kramer post-hoc testing. (c) Western blotting was performed for HSF-1, Hsp70, and Akt expression in BT-474, MCF-7, and MDA-MB-231 cells after treatment with 100 µM HS-27 for 12, 24, or 48 hours. Cropped western blots are shown; full blots can be found in Supplementary Figure S1. Control cells were incubated with DMSO vehicle. Western blots were performed in triplicate.
Figure 2
Figure 2
Hsp90 inhibition decreases oxidative and glycolytic metabolism in Her2-overexpressing and triple negative breast cancer. A seahorse extracellular flux analyzer was used to determine the baseline and post-treatment metabolic properties of BT-474, MCF-7, and MDA-MB-231 cells. The endpoints monitored were oxygen consumption rate (OCR, left column) and extracellular acidification rate (ECAR, right column). (a) Baseline OCR for each cell line. (b) Baseline ECAR for each cell line. (c) OCR or (d) ECAR for each cell line after 12, 24, or 48-hour treatment with 100 µM HS-27 or DMSO (vehicle). (e) MDA-MB-231, MCF-7, and BT-474 cells were plated at uniform density and treated with either 100 µM HS-27 or DMSO control for 48 hours. ANOVA with Tukey-Kramer post hoc testing (n = 6) was used for (a) and (b), while two-sided t-tests (n = 6) were used for (c) and (d) (n = 3) for (e).
Figure 3
Figure 3
HS-27 uptake is increased in aggressive breast tumor types in vivo. (a and b) Representative transmission and fluorescence images from tumor (MDA-MB-231 and BT-474) and non-tumor bearing window chambers in mice injected with either 20 mg/kg HS-27 (A) or 0.1 mL of 6 mM 2-NBDG (b). Transmission images are shown for reference of the tumor location. Scale bar is 2 mm. (c) Representative HS-2760 or 2-NDBG60/RD images for MDA-MB-231 and BT-474 window chambers. (d) Average HS-2760 and 2-NBDG60/RD were plotted against each other, revealing a strong correlation between the two endpoints (R2 = 0.96), red = MDA-MB-231, cyan = BT-474, and black = non-tumor window chambers. For HS-27 imaging, n = 3 for all groups. For 2-NBDG imaging, n = 3 for tumor groups, and n = 8 for normal groups.
Figure 4
Figure 4
Ex vivo HS-27 application retains contrast between tumor and non-tumor tissue. (a) Sample images of mouse tumor tissue treated ex vivo with 100 µM HS-27 or 100 µM inactivated HS-27 (HS-217) for one minute (b) Probability distribution functions (PDFs) of the HS-27 (n = 3) and HS-217 (n = 3) fluorescence values demonstrate significantly greater fluorescence in HS-27 treated samples than HS-217 treated samples. (c) Sample images of mouse tumor tissue and mouse skin tissue treated ex vivo with 100 µM HS-27 for one minute (d) PDFs of the HS-27 fluorescence values for both tumor (n = 3) and non-tumor (n = 3) are shown beneath the images. Fluorescence was significantly greater in tumor than non-tumor samples. (e) Sample images of tumor or non-tumor mouse tissue at 60-minutes after i.v. injection of 20 mg/kg HS-27. (f) PDFs of HS-27 fluorescence values for both tumor (n = 3) and non-tumor (n = 3) demonstrate significantly greater fluorescence in tumor than non-tumor samples. P-values were calculated using a Kolmogorov Smirnov test.
Figure 5
Figure 5
A rapid assay for Hsp90 imaging in clinical breast specimens. (a and b) Representative fluorescence images of an ultrasound-guided core-needle biopsy treated ex vivo with 100 µM HS-27 for one minute for an ER + /PR + tumor (a) and non-tumor (b) biopsy. Tissue types were determined by a trained pathologist using the histology images shown to the left of the fluorescence images. The top right corner of each tumor image shows the percentage of total tumor involvement in that region along with the percent cellularity. (c) Plotting integrated fluorescence as a function of percent cancer at each site (n = 96) demonstrates a positive and significant correlation between the percent invasive cancer and HS-27 uptake at site level. There is one data point outside the graph range that is not shown, but was included in the analysis. (d) Plotting the average integrated fluorescence for each biopsy stratified by tumor (n = 6) and non-tumor (n = 6) sites reveals a positive and significant correlation between the percent invasive cancer and HS-27 uptake at biopsy level. (E-H) PDFs created from (e) all non-tumor images from all biopsies (n = 45), (f) all tumor images from sites with between 25% and 50% tumor involvement (n = 7), (g) all tumor images from sites with between 50% and 75% tumor involvement (n = 7), and (h) all tumor images from sites with greater than 75% tumor involvement (n = 25). The dashed black line shows the mean tumor fluorescence from all images containing tumor regardless of percent tumor involvement. The number to the right of the dashed black line represents the percentage of pixels falling above the overall tumor mean for each case.

References

    1. Whitesell L, Lindquist SL. HSP90 and the chaperoning of cancer. Nat Rev Cancer. 2005;5:761–772. doi: 10.1038/nrc1716. - DOI - PubMed
    1. Barrott JJ, Haystead TA. Hsp90, an unlikely ally in the war on cancer. FEBS J. 2013;280:1381–1396. doi: 10.1111/febs.12147. - DOI - PMC - PubMed
    1. Trepel J, Mollapour M, Giaccone G, Neckers L. Targeting the dynamic HSP90 complex in cancer. Nat Rev Cancer. 2010;10:537–549. doi: 10.1038/nrc2887. - DOI - PMC - PubMed
    1. Hanahan D, Weinberg RA. Hallmarks of cancer: the next generation. Cell. 2011;144:646–674. doi: 10.1016/j.cell.2011.02.013. - DOI - PubMed
    1. Sharp S, Workman P. Inhibitors of the HSP90 molecular chaperone: current status. Adv Cancer Res. 2006;95:323–348. doi: 10.1016/S0065-230X(06)95009-X. - DOI - PubMed

Publication types

MeSH terms