. 2017 Dec 21;552(7685):368-373.
doi: 10.1038/nature25023. Epub 2017 Dec 13.

Mechanisms of mTORC1 activation by RHEB and inhibition by PRAS40

Affiliations

Mechanisms of mTORC1 activation by RHEB and inhibition by PRAS40

Haijuan Yang et al. Nature. .

Abstract

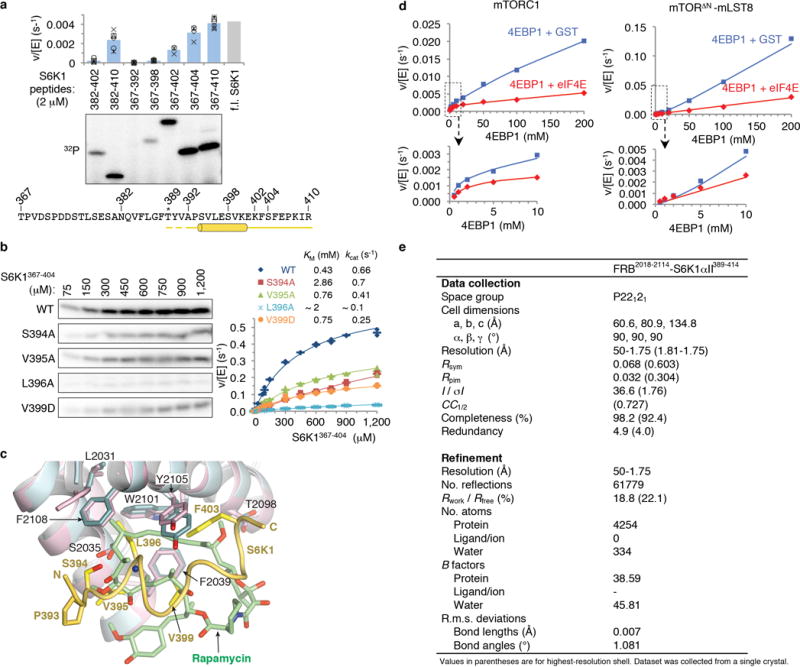
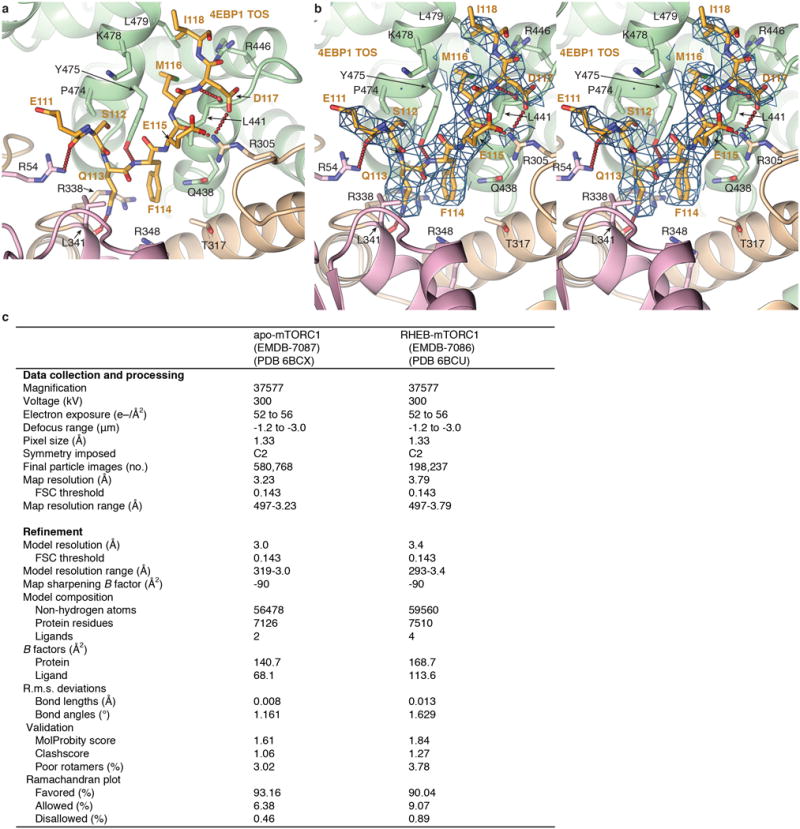
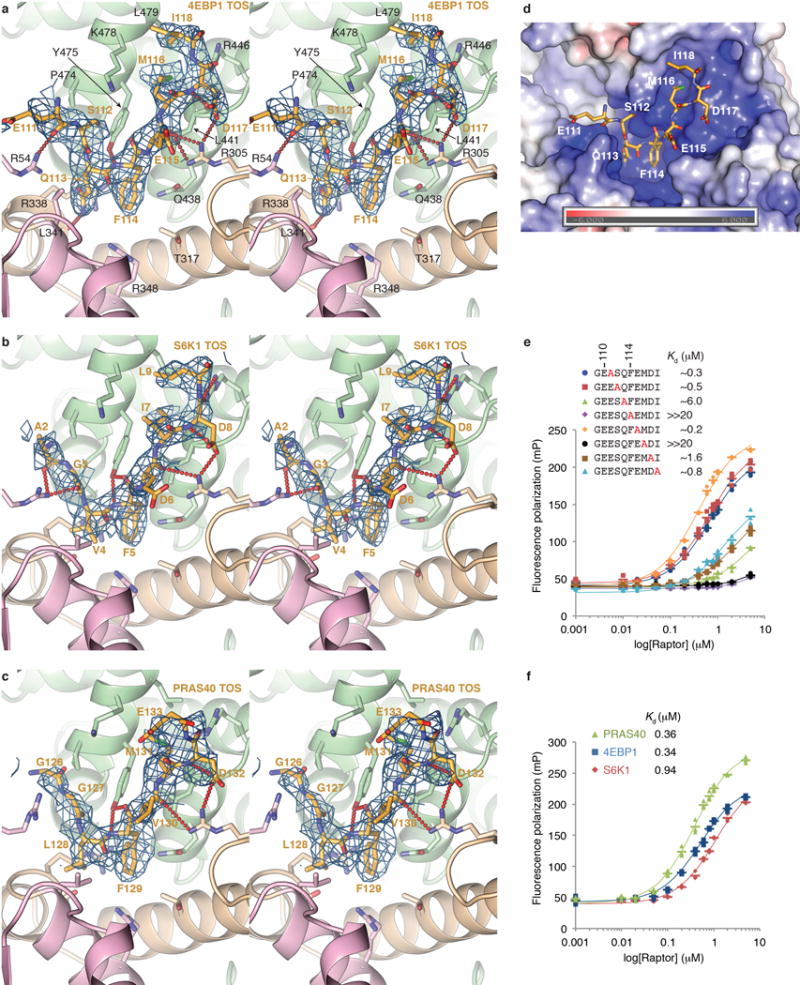
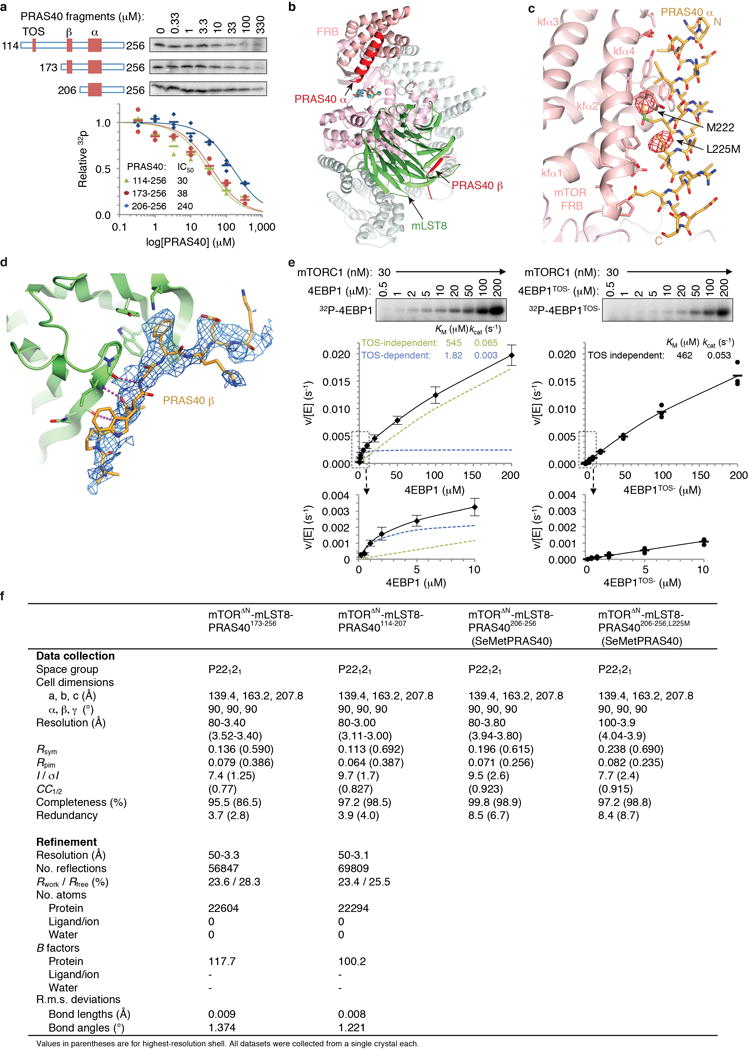
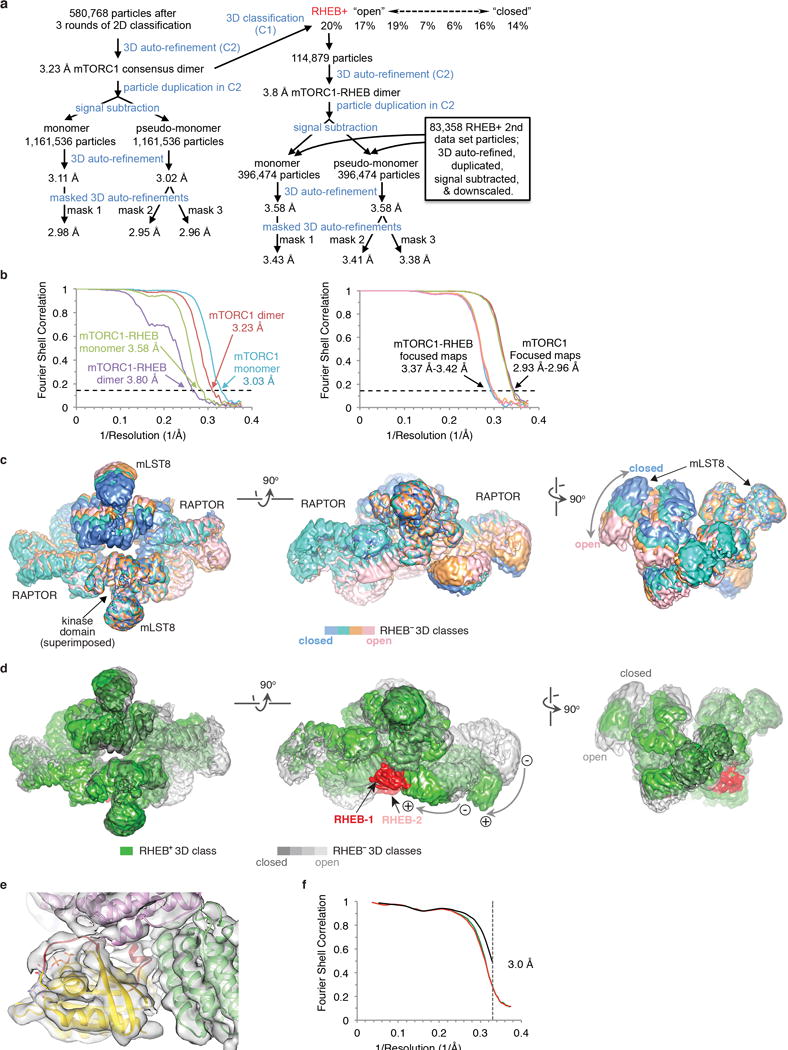
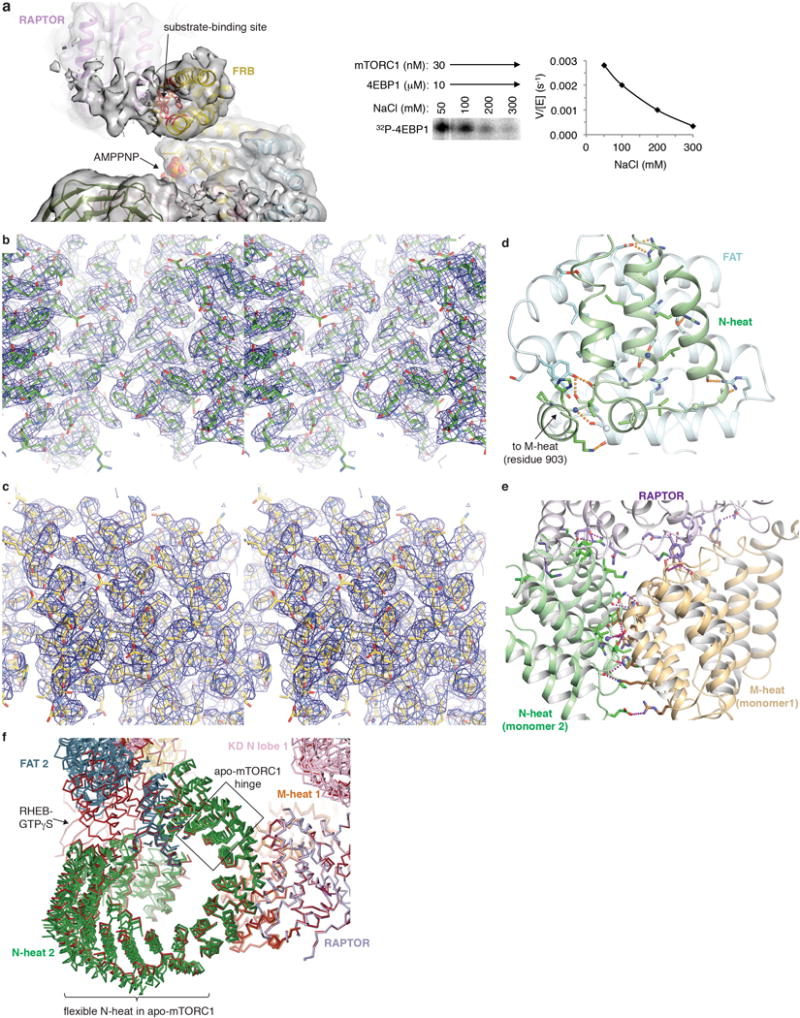
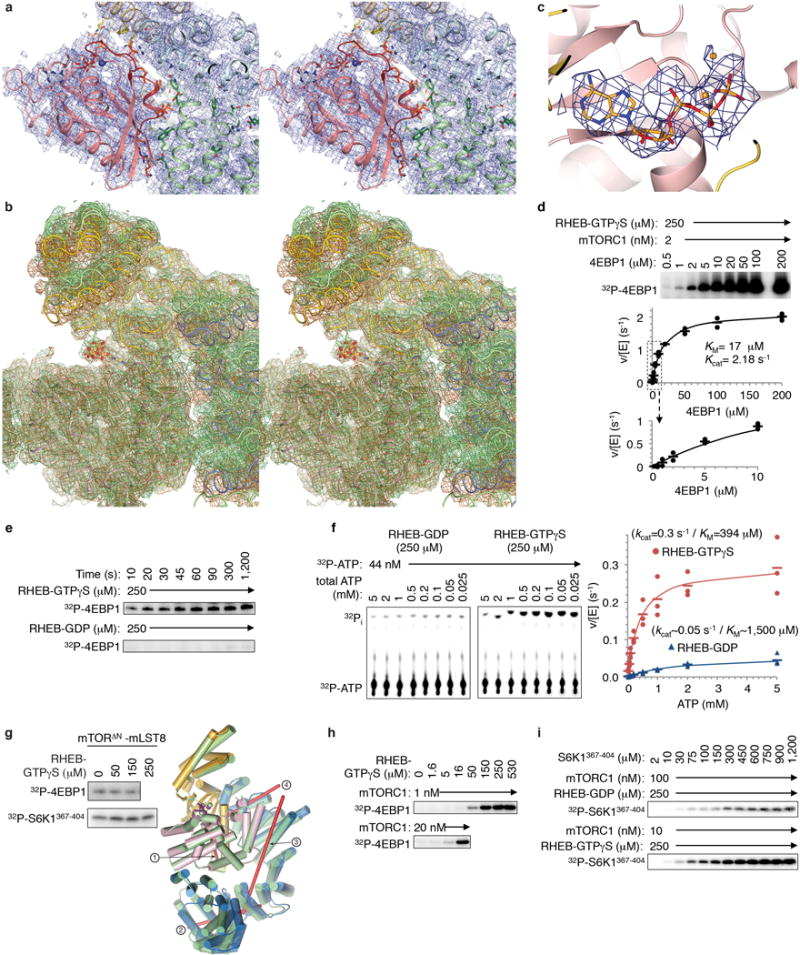
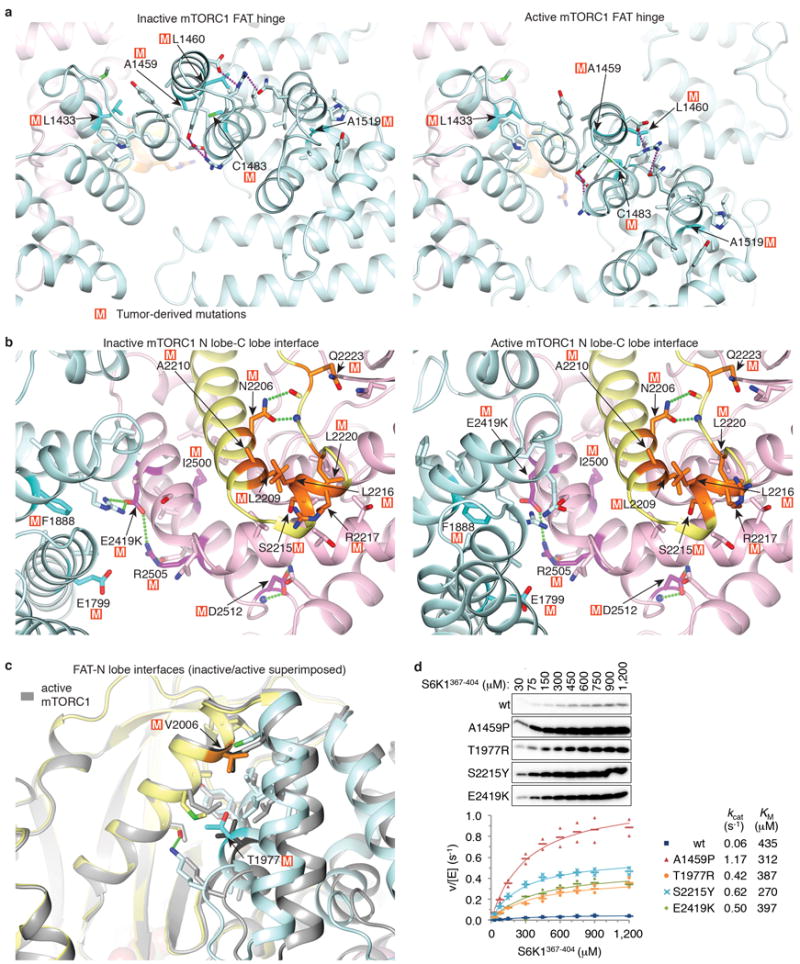
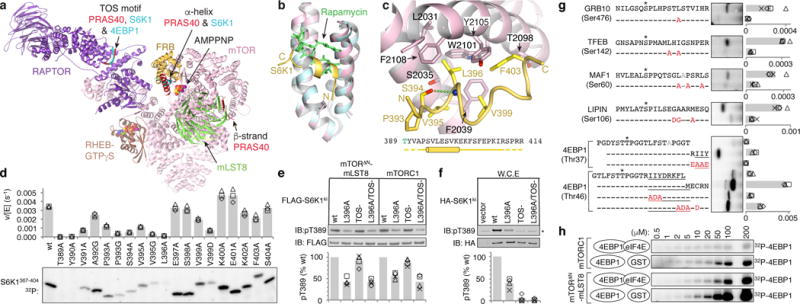
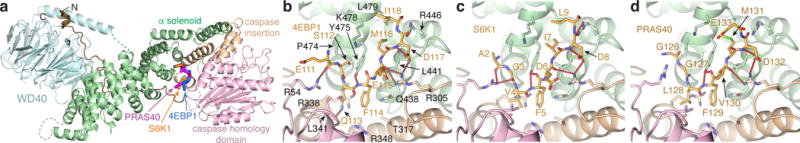
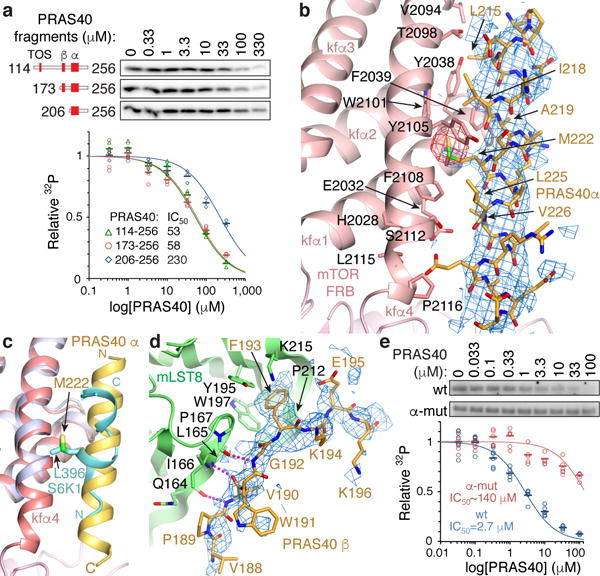
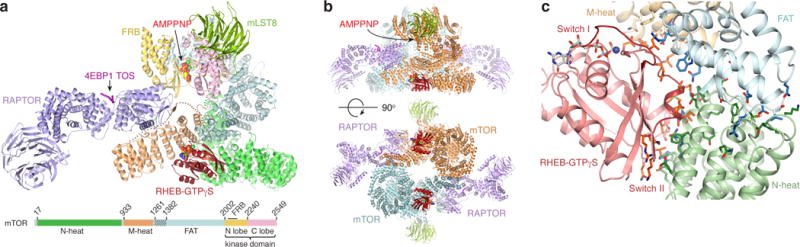
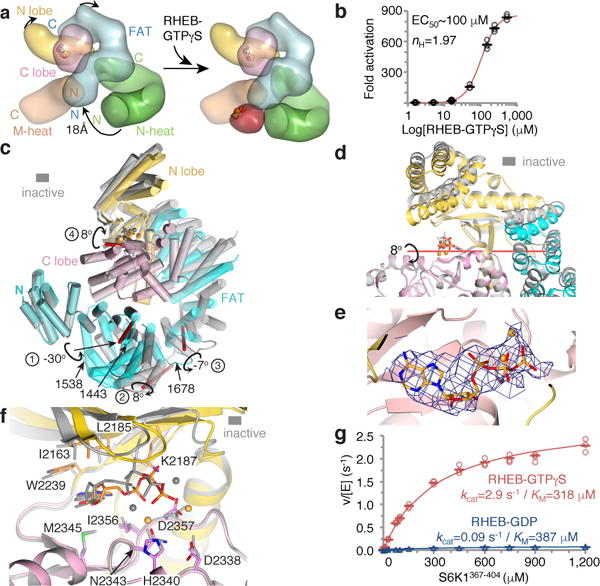
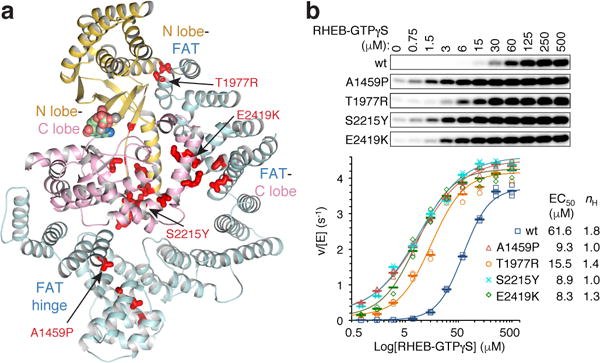
The mechanistic target of rapamycin complex 1 (mTORC1) controls cell growth and metabolism in response to nutrients, energy levels, and growth factors. It contains the atypical kinase mTOR and the RAPTOR subunit that binds to the Tor signalling sequence (TOS) motif of substrates and regulators. mTORC1 is activated by the small GTPase RHEB (Ras homologue enriched in brain) and inhibited by PRAS40. Here we present the 3.0 ångström cryo-electron microscopy structure of mTORC1 and the 3.4 ångström structure of activated RHEB-mTORC1. RHEB binds to mTOR distally from the kinase active site, yet causes a global conformational change that allosterically realigns active-site residues, accelerating catalysis. Cancer-associated hyperactivating mutations map to structural elements that maintain the inactive state, and we provide biochemical evidence that they mimic RHEB relieving auto-inhibition. We also present crystal structures of RAPTOR-TOS motif complexes that define the determinants of TOS recognition, of an mTOR FKBP12-rapamycin-binding (FRB) domain-substrate complex that establishes a second substrate-recruitment mechanism, and of a truncated mTOR-PRAS40 complex that reveals PRAS40 inhibits both substrate-recruitment sites. These findings help explain how mTORC1 selects its substrates, how its kinase activity is controlled, and how it is activated by cancer-associated mutations.


Conflict of interest statement

Author Information: The authors declare no competing financial interests.

Figures

Extended Data Figure 1
Extended Data Figure 1. Substrate recruitment by the FRB domain
a, Deletion mapping of S6K1 FRB-binding motif polypeptides (2 μM) using phosphorylation by the mTORΔN-mLST8 (30 nM) as the assay, extending previous findings. Truncation up-to 7 residues N-terminal to the Thr389 phosphorylation site (indicated by asterisk) has minimal effect, whereas C-terminal truncations starting 15 residues from Thr389 successively reduce phosphorylation. The polypeptides were produced as described in Methods for the S6K1367–404 peptide. Column graph shows velocity divided by enzyme concentration from the quantitation of the 32P autoradiogram. Columns show means and markers show values from independent experiments (n=6 for 382–410, 367–392, 367–398 and 367–410 reactions, n=5 for 382–402, n=4 for 367–404, and n=3 for 367–402). The column labeled f.l. S6K1 shows the phosphorylation level of full-length S6K1ki (ki superscript indicates the kinase-inactive K100R mutant) under the same conditions, as reported by Yang et al.. Truncation of the S6K1 peptide to 20 residues (S6K1382–402), which is the standardized length used in the peptide library of Figure 1g, reduces phosphorylation to ~20 % of S6K1367–404, likely in part because of end-effects destabilizing the helix as well as eliminating some minor contacts. b, Michaelis-Menten steady state kinetic constants for mTORΔN-mLST8 (30 nM) phosphorylating wild type and the indicated mutant S6K1367–404 peptides, quantified as in a. Graph shows means (dashes) and values (markers as indicated) from independent experiments (n=3, except for the 1, 2, 10, 750, 900 and 1,200 μM points which are n=2). Also shown are the KM and kcat values, calculated by non-linear regression fitting of the data, above the graph, and their simulated curves in the graph. Mutations that significantly reduced phosphorylation but do not make substantial direct FRB contacts include S394A, which eliminates a hydrogen bond that stabilizes the helix N-terminus, and the helix breaking V395G mutation that further reduces phosphorylation compared to V395A (Fig. 1d); together, these point to the importance of the helical conformation. Additional mutations include Val391 and Pro393, in the segment between Thr389 and the start of the helix. Pro393 may be important for guiding the FRB-anchored substrate to the kinase active site, and that the P+2 residue Val391 may be involved in contacts to the kinase C lobe, where, by analogy to canonical kinases, the peptide segment of the phosphorylation site and its immediate vicinity are expected to bind to. c, Superposition of the FRB-S6K1 interface onto the FRB-rapamycin-FKBP12 structure (FKBP12 is omitted from clarity), highlighting the similarities in the binding of the Leu396 side chain to the same pocket as rapamycin’s key C23 methyl group and flanking portions of its triene arm. The FRB-S6K1 interface is colored as in Figure 1b, rapamycin green and its associated FRB domain cyan. In the crystals of the FRB-S6K1389–414 fusion protein, S6K1 residues 389–391 and 411–414 are disordered, while residues 405–410 are involved in crystal packing. d, Graph with the quantitation of the reactions shown in Figure 1h. e, X-ray data collection and refinement statistics for the FRB2018–2114-S6K1αII389–414 fusion protein structure.
Extended Data Figure 2
Extended Data Figure 2. RAPTOR-4EBP1 TOS interface and density in the Cryo-EM structure of mTORC1
a, Human RAPTOR-4EBP1 TOS interface from the 3.0 Å refined human mTORC1 cryo-EM structure, colored as in Figure 2b. Only the RAPTOR side chains that make hydrogen bond (red dotted lines), electrostatic or van der Waals contacts to 4EBP1 are shown. b, Stereo view of the cryo-EM density of the human RAPTOR-4EBP1 TOS interface. Although the complex contained full-length 4EBP1, only an 8-residue segment is ordered in the cryo-EM reconstruction (also see Extended Data Fig. 7a). c, Cryo-EM data collection and refinement statistics.
Extended Data Figure 3
Extended Data Figure 3. AtRaptor-TOS motif crystal structures and human RAPTOR-TOS motif dissociation constants
a, Stereo view of the mFo-dFc electron density of the atRaptor-4EBP199–118 co-crystals, calculated with phases from atRaptor before any 4EBP1 was built into the model. The structure is colored as in Figure 2b, and the map, calculated at 3.0 Å and contoured at 2.2 σ, is shown as blue mesh. Of 20-residues in the 4EBP1 peptide in the crystals, only the 8-residue segment shown is ordered. b, Stereo view of the mFo-dFc electron density, calculated as in a, of the atRaptor-S6K11–14 co-crystals. The 3.1 Å map is contoured at 2.2 σ. As with the 4EBP1 co-crystals, only 8 of the 14 S6K1 residues are ordered. c, Stereo view of the mFo-dFc electron density, calculated as in a, of the atRaptor-PRAS40124–139 co-crystals. The 3.35 Å map is contoured at 1.9 σ. Only 8 of the 16 PRAS40 residues are ordered. In addition, side chain of Glu133 has poor density and is only tentatively built. d, Molecular surface representation of the atRaptor TOS-binding groove, colored according to the electrostatic potential (–6 to +6 kT) calculated without the 4EBP1 peptide (shown as sticks) using APBS and illustrated with PyMOL. The TOS-binding groove has an overall basic electrostatic potential owing to five arginine and one lysine residues, explaining the tendency of acidic residues to be present at the non-conserved and flanking positions of the TOS motif. e, Binding of the indicated human 4EBP1 TOS mutant peptides (mutation in red) to human RAPTOR measured by fluorescence polarization anisotropy. Graph shows means as dashes and values from three independent experiments with the indicated markers and colors. Dissociation constants from the non-linear regression fitting of the data are also shown, and simulated binding curves are overlaid on the data. f, Binding of the TOS motif peptides of human 4EBP1 (blue), S6K1 (red) and PRAS40 (green) to human RAPTOR measured by fluorescence polarization anisotropy. Graph shows means as dashes and values from three independent experiments with the indicated markers and colors. Also shown are the dissociation constants from the non-linear regression fitting of the data and the simulated binding curves.
Extended Data Figure 4
Extended Data Figure 4. PRAS40 is a competitive inhibitor of the FRB substrate-recruitment site and additionally binds to mLST8
a, Inhibition of mTORΔN-mLST8 (30 nM) phosphorylating the TOS-less 4EBP142–64 (10 μM) by indicated PRAS40 fragments (red rectangles mark TOS, β strand and amphipathic α helix). 32P incorporation is plotted as a fraction of the zero PRAS40 reaction of each series, with means as dashes and values from independent experiments with the indicated markers and colors (n=3 for PRAS40206–256; n=2 for PRAS40114–256 and PRAS40173–256). IC50 values from the non-linear regression fitting of the data and their simulated curves are also shown. b, Co-crystal structure of the PRAS40173–256–mTORΔN–mLST8 complex. The mTOR FAT domain is colored cyan, FRB salmon, kinase pink, mLST8 green and PRAS40 red. c, Anomalous diffraction fourier map (red mesh) of crystals containing the SeMet-substituted L225M mutant of PRAS40206–256 bound to mTORΔN-mLST8 showing two SeMet peaks that confirm the direction of the PRAS40 helix. The 5.4 Å map is contoured at 3.5 σ and superimposed on the structure of the wild type complex, which has a slightly different unit cell from the SeMet crystals. The anomalous diffraction map of wild type seleno-methionine substituted PRAS40 co-crystals is shown in the main text (Fig. 3b). d, mFo-dFc electron density of PRAS40114–207, which contains only one of the three phenylalanine residues present in the PRAS40173–256 polypeptide, bound to mTORΔN-mLST8 confirming the sequence assignment of the PRAS40 beta strand. Map was calculated with phases from before PRAS40 was built into the model. The structure and map, calculated at 3.0 Å and contoured at 2 σ, are colored as in Figure 3d. e, Phosphorylation of full-length 4EBP1 by apo-mTORC1 (left panel) does not obey Michaelis-Menten kinetics, and in the absence of a single substrate KM value we cannot calculate the Ki of full-length PRAS40 for the reaction of Figure 3e. Left panel shows the 32P incorporation data, plotted as velocity over enzyme concentration (means ±s.d., n=11 except for the 10, 50 and 200 μM reactions that are n=6), for the curve of apo-mTORC1 phosphorylating full-length 4EBP1. The curve of reaction velocity/[enzyme] versus substrate concentration is parabolic, with product levels comparatively higher at low substrate concentration (up-to around 10 μM) and lower at higher substrate concentration than a Michaelis-Menten type response. The two substrate concentration ranges display very different KM and kcat values. The entire substrate range can thus be modeled (black curve) as the sum of two reactions, one having a tight KM of ~2 μM but very slow kcat of 0.003 s−1 (blue dashed curve), and another reaction of a weak KM of 545 μM but a faster kcat of 0.065 s−1 (green dashed curve). The tight KM reaction is dependent on the TOS motif, as its mutation (right panel; graph shows means as dashes and values from three independent experiments) results in a reaction that obeys Michaelis-Menten kinetics, with KM and kcat values of 462 μM and 0.053 s−1, respectively, that are very similar to the values of the weak KM faster kcat curve of w.t. 4EBP1. We presume that the TOS-independent weak KM reaction reflects, in part, substrate interactions with the FRB. It is possible that the non-Michaelis-Menten behavior is due to the presence of multiple, likely non-equivalent phosphorylation sites on 4EBP1. We also cannot reliably measure the KM value of full-length S6K1, as this substrate aggregates and then precipitates at concentrations higher than ~50 μM, before reaching saturation (not shown). f, X-ray data collection and refinement statistics for the structures of mTORΔN-mLST8 bound to PRAS40 fragments.
Extended Data Figure 5
Extended Data Figure 5. Cryo-EM reconstruction of mTORC1 and RHEB-mTORC1 complexes
a, Flow chart of single particle cryo-EM data processing. Details are described in Methods. b, Left graph shows gold-standard FSC plots between two independently refined half-maps for the consensus mTORC1 C2 reconstruction (red curve), the masked monomer with signal subtraction (blue curve), the RHEB-mTORC1 C2 reconstruction (purple curve), the masked RHEB-mTORC1 monomer with signal subtraction containing additional signal-subtracted particles from a second, downscaled data set (green curve). The FSC cutoff of 0.143 and associated resolution for each plot are marked. Right graph shows gold-standard FSC plots for the three focused refinements of the consensus mTORC1 C2 reconstruction with mask 1 (purple curve), mask 2 (red curve) and mask 3 (green curve) described in Methods. Also shown are the corresponding curves for RHEB-mTORC1 masks 1, 2, 3 in cyan, orange and pink. The FSC cutoff of 0.143 and associated resolution ranges of the three masked refinements for consensus mTORC1 and RHEB-mTORC1 are marked on each plot. c, The four largest RHEB-less 3D classes of the flowchart (a) superimposed on the C-lobe of the kinase domain (marked by arrow) of one mTOR protomer. The closest approach of the two mLST8 subunits ranges from 123 Å (“closed” conformation in light blue) to 145 Å (“open” conformation in pink). The RHEB-containing class and two minor classes of suboptimal density are omitted for clarity. The four classes shown appear to represent samples along a continuum of conformations between the open and closed states, as more intermediate states get populated in a 3D classification with a larger number of classes (not shown). The 3D classes shown are from a calculation with a partial data set ~50% the size of the final data set. d, Comparison of the RHEB-containing class (green, with the RHEB density in red) with the RHEB-less classes (colored light gray to dark gray). The maps are superimposed as in c. The RHEB-containing class has two RHEB molecules with very similar density, even though the 3D classification was done in C1. In the figure, one of the two RHEBs is occluded in the left and right panels, and is in lighter background (labeled as RHEB-2) in the middle panel. None of the RHEB-less classes has any significant density at either of the two RHEB-binding sites. The RHEB-containing class has an inter-mLST8 distance intermediate of the open and closed conformations of the RHEB-less classes, but the relative positions of N-heat and its associated RAPTOR are distinct from the apparent continuum of conformational states of the RHEB-less classes. Curved arrows indicate the transitions from the RHEB-less classes (“minus” sign) to the RHEB-containing (“plus” sign) class. e, Cryo-EM density of the RHEB-containing particles from the 3D classification showing cartoon representations of the refined RHEB-GTPγS structure (yellow, its switch I and II segments in red,) and the RHEB-interacting portions of the mTOR N-heat (green) M-heat (pink) and FAT (pink) segments. f, FSC plots of the final model versus the composite cryo-EM map from REFMAC5 (black), and of a model validation protocol refining against one of two half maps after an initial random displacement of atoms is applied to the model to remove model bias (FSCwork in red), and cross-validating the same model against the other half map (FSCfree green).
Extended Data Figure 6
Extended Data Figure 6. Secondary structure and conservation of mTOR
Human mTOR sequence showing conservation from yeast to man (blue column graph above sequence) and secondary structure elements in the refined model. Helices are indicated as rectangles, β strands as arrows, segments lacking regular secondary structure as solid lines, and disordered regions as dashed lines. N-heat secondary structure is colored green, M-heat orange, FAT in cyan (including helices fα1 to fα6 that are continuous with the FAT structure, even though they are outside the FAT boundary defined by sequence conservation in PIKKs), the kinase domain N-lobe in yellow (FRB helices are name kfα1 to kfα4 for consistency with the mTORΔN-mLST8 paper) and C-lobe in pink. The three hatched N-heat helices have not been assigned a sequence, and their boundaries are indicated tentatively. The dashed-lines indicate disordered regions.
Extended Data Figure 7
Extended Data Figure 7. Apo-mTORC1 cryo-EM density, interfaces and conformational flexibility
a, The 4EBP1 amphipathic helix density on the FRB does not have interpretable cryo-EM density. The map shown is of a 3D class (~30 % of particles) with the highest relative level of density; the FRB side chains that contact the S6K1 substrate in Figure 1c are shown as red sticks to map the site, the rest of mTOR is colored as in Figure 4a, and AMPPNP is in space-filling representation. Unlike the 4EBP1 TOS, which has a level of density comparable to that of its binding site (Extended Data Fig. 2b), the putative density of the 4EBP1 amphipathic helix is much weaker than that of the FRB, suggestive of partial occupancy. We presume this is due, in part, to our cryo-EM samples containing 260 mM NaCl, which substantially reduces 4EBP1 phosphorylation and thus likely further weakens substrate-FRB association (right panel). b, Stereo view of the 3.0 Å cryo-EM density of the consensus apo-mTORC1 reconstruction, showing mTOR N-heat (residues ~650–850 shown in stick representation colored half-bonded green, red and blue for C, O, N atoms, respectively). c, Stereo view of the 3.0 Å cryo-EM density of the consensus apo-mTORC1 reconstruction showing mTOR M-heat (residues ~960–1105 shown in stick representation colored half-bonded sand, red and blue for C, O, N atoms, respectively). d, The end of the N-heat solenoid (residues 848–898; green) is anchored on the middle of the FAT domain (residues 1565–1627; light cyan). Close-up view showing side chains (glycine Cα atoms as spheres) and backbone groups (blue spheres for amide and sticks for carbonyl groups) involved in intra-molecular van der Waals or hydrogen bond (yellow dotted lines). For clarity, only N-heat residues 836–903 and FAT residues 1537–1664 are shown. e, The mTOR binding elements of RAPTOR (purple) are encompassed within its conserved RNC, with the caspase domain contacting M-heat of one mTOR protomer (sand), the caspase insertion contacting both M-heat and the N-heat (green) of the other mTOR protomer, and the first three armadillo repeats of its solenoid contacting N-heat. Side chains are shown as in d. Hydrogen bond contacts are shown as red dotted lines. N-heat and M-heat structural elements above the plane of the figure are omitted for clarity. f, The conformational flexibility of apo-mTORC1 is associated with bending at a major hinge region of three heat repeats (indicated by a box) in the N-heat solenoid, in between its FAT and RAPTOR-M-heat interacting segments. Figure shows Cα trace of the tripartite interface between N heat of protomer 2, M heat of protomer 1 and RAPTOR of the four apo-mTORC1 3D classes of Exteded Data Figure 5c (colored as in Figure 4a) and RHEB-mTORC1 (all red). The four apo-mTORC1 classes were refined to 4.5 Å or better and together with RHEB-mTORC1 were superimposed on RAPTOR (residues 52–422). Figure also highlights the flexibility on the N-terminal half of the N-heat solenoid in apo-mTORC1 (see Supplementary Information discussion).
Extended Data Figure 8
Extended Data Figure 8. RHEB-induced conformational change in mTORC1
a, Stereo view of the cryo-EM density from the 3.4 Å RHEB-mTORC1 reconstruction, showing the RHEB-mTOR interface in the same orientation and coloring as in Figure 4c. The RHEB-interacting segments of mTOR are nα3 to nα7 of N-heat, mα2-mα4 of M-heat and fα2-fα3 of FAT. The majority of the contacts made by RHEB are from its switch I and switch II regions, with a small number of additional contacts to N-heat and M-heat contributed by the nearby segments of residues 5 to 7 and 106 to 111. b, Stereo view of cryo-EM density from RHEB-mTORC1 (sand) and the 3.0 Å apo-mTORC1 (green), with the two structures and maps superimposed on the C lobes as in Figure 5d. c, AMPPNP (orange) cryo-EM density of apo-mTORC1. d, Steady state kinetic analysis of mTORC1 phosphorylation of intact 4EBP1 in the presence of 250 μM RHEB-GTPγS. Reactions quantified by 32P incorporation and plotted as velocity over enzyme concentration (means as dashes and values from two independent experiments as filled circles). The KM and kcat values, calculated by non-linear regression fitting of the data, and simulated curves are also shown. Note that in contrast to the reaction in the absence of RHEB shown in Extended Data Figure 4e, the curve of reaction velocity versus 4EBP1 concentration obeys Michaelis-Menten kinetics. e, RHEB-GTPγS activation of 4EBP1 phosphorylation by mTORC1 under single-turnover conditions. A master mix of excess mTORC1 (500 nM) over 4EBP1 substrate (100 nM) was incubated with 250 μM RHEB-GTPγS or 250 μM RHEB-GDP in the standard kinase buffer on ice for 5 minutes. Reactions were started by the addition of a mixture of cold ATP (50 μM final) and [γ -32P] ATP (8 μCi per reaction time point). The reactions were done on ice to slow down the reaction. At indicated time points, an aliquot of the reaction was drawn, stopped, and analyzed as described in Methods. The experiment was repeated three times with very similar results. f, ATP steady-state kinetic parameters of ATP hydrolysis by mTORC1 in the presence of 250 μM RHEB-GDP (left, blue plot) or RHEB-GTPγS (right, red plot). Reactions quantified by 32P incorporation as in d. Graph shows means as dashes and values from three independent experiments with the indicated markers and colors. The steady-state kinetic constants of the RHEB-GDP containing reaction are approximate owing to the weak signal of these reactions. g, As expected, RHEB-GTPγS did not activate the truncated mTORΔN-mLST8 complex phosphorylating 4EBP1 or S6K1367–404 (10 μM both; mTORΔN at 20 and 30 nM, respectively) (left panel; experiments were repeated two times with very similar results). mTORΔN-mLST8 has an intermediate kcat of 0.66 s−1 (Extended Data Fig. 1b) compared to the 0.09 and 2.9 s−1 kcat values of apo-mTORC1 and RHEB-mTORC1, respectively (Fig. 5g). mTORΔN-mLST8 has a distinct FAT conformation likely due to the absence of N-heat. Right panel shows superposition of the FAT plus kinase domain portions of inactive apo-mTORC1 on the crystal structure of mTORΔN-mLST8 done by aligning their C lobes. Apo-mTORC1 is in green and mTORΔN is colored blue for FAT, yellow for N-lobe and pink for C-lobe. The rotation axes (red lines) are numbered according to the hinges of Figure 5c. Compared to the inactive to active transition, the comparison of the mTORΔN FAT conformation to that of the inactive state exhibits bigger changes around the major hinge with a rotation in the opposite direction and a different rotation axis far from the hinge axis (labeled “1”). The rotations around the two minor hinges are comparably modest although distinct, with the rotation axes nearly orthogonal to those of the inactive to active transition. h, Autoradiogram showing activation of mTORC1 phosphorylating 4EBP1 (10 μM) by RHEB-GTPγS, repeated three times. Gel quantification is shown in Figure 5b. i, Steady-state kinetic analysis of mTORC1 phosphorylating S6K1367–404 in presence of 250 μM RHEB-GDP (top row) or RHEB-GTPγS (bottom row). 32P incorporation data is plotted as velocity over enzyme concentration in Figure 5g (n=3).
Extended Data Figure 9
Extended Data Figure 9. Hyperactivating mTOR mutations cluster in three regions of the mTOR structure
a, Hyperactivating mutations that cluster at the major hinge region of the FAT domain. The mutations, which occur at residues with structure-stabilizing roles, likely disrupt the structural integrity of the FAT clamp and thus its ability to block the movement of the N lobe into the active position. Cancer-genome mutations shown experimentally to be hyperactivating are mapped onto the apo-mTORC1 (left) and RHEB-mTORC1 (right) structures. The two structures are aligned on the C lobes of their kinase domains to highlight the different packing arrangements at the hinge. The side chains of mutated residues are indicated with the letter “M” and colored dark cyan, the side chains that they interact with are in light cyan, while the rest of the structural elements are colored as in Figure 4a. Red dotted lines indicate groups within hydrogen bond distance. b, The largest cluster of hyperactivating mutations is centered on an N lobe helical extension (kα3, kα3b) that is anchored in a pocket between the C lobe and FAT domains. Here, the structural mutations either at the N lobe kα3-kα3b helices or at their binding site on the C lobe and the adjacent FAT domain would weaken the structural coupling of the N lobe with the C lobe, possibly allowing the N lobe to assume conformations closer to its active state. Mutations mapped onto the apo-mTORC1 (left) and RHEB-mTORC1 (right) structures. c, Hyperactivating mutations that cluster at where the FAT transitions into and packs with the N lobe. Mutations here likely destabilize the structural elements and their packing that prevents the N lobe from moving into its active position, mimicking the RHEB-induced conformational change and the associated looser FAT-N lobe interface. Mutations are mapped onto apo-mTORC1 (FAT in cyan, N lobe yellow, C lobe pink) and RHEB-mTORC1 (all in gray). The two structures are superimposed on their N lobe domains to facilitate comparison. d, Steady-state kinetic analysis of S6K1367-404 phosphorylation by 30 nM mTORC1 containing w.t. or the indicated hyperactive mTOR mutants. 32P incorporation was quantified and velocity over enzyme concentration values were plotted as means (dashes) and values from two independent experiments with the indicated markers and colors. Dissociation constants from the non-linear regression fitting of the data are also shown, and simulated binding curves are overlaid on the data.
Figure 1
Figure 1. The FRB domain is a substrate-recruitment site
a, Composite image of S6K1 and PRAS40 sub-complex crystal structures superimposed on a RHEB-mTORC1 monomer from the cryo-EM structure. b, The FRB (pink) bound to the S6K1 peptide (yellow) superimposed on the FRB-Rapamycin-FKBP12 complex (blue FRB, green rapamycin; FKBP12 omitted). c, S6K1-FRB interface, S6K1 sequence and secondary structure (cylinder, helix; yellow dashes, unstructured). d, Phosphorylation of w.t. and mutant S6K1367–404 (2 μM) by mTORΔN-mLST8 (30 nM). 32P incorporation plotted as reaction velocity over enzyme concentration (means as columns, three independent experiments with markers). e, In vitro phosphorylation of w.t. and mutant FLAG-S6K1ki (2 μM) by 30 nM mTORΔN-mLST8 or mTORC1. f, Phosphorylation of w.t. and mutant HA-S6K1ki in HEK293 cells (asterisk, endogenous S6K1). In e and f, products detected by pT389-specific antibody and plotted relative to the w.t. reaction of each series (means as columns, four independent experiments with markers). g, Phosphorylation of indicated w.t. and mutant (red mutation) peptides (10 μM) of indicated substrates. Plotted as bars for means and markers for independent experiments (4EBP1, n=3; rest, n=4). 4EBP1 amphipathic helix underlined; asterisk, phosphorylation sites; gray, alanine mutated second phosphorylation sites. h, Phosphorylation of indicated 4EBP1 concentrations by 30 nM mTORΔN-mLST8 or mTORC1 in the presence of 1 molar equivalent eIF4E or GST control (plotted in Extended Data Fig. 1d).
Figure 2
Figure 2. RAPTOR structure and TOS motif recognition
a, atRaptor structure with the three TOS motif co-crystal structures superimposed. atRaptor domains colored as labelled (N-terminal extension dark brown). b–c, Close-up views of the interface between atRaptor, colored as in a, and TOS peptides (yellow sticks) of human 4EBP1 (b), S6K1 (c) and PRAS40 (d). atRaptor side chains shown are identical in human RAPTOR, whose residue numbers are shown (red-dotted lines, hydrogen bonds).
Figure 3
Figure 3. PRAS40 blocks the FRB substrate-recruitment site
a, Inhibition of mTORΔN-mLST8 (30 nM) phosphorylating S6K1367–404 (10 μM) by indicated PRAS40 fragments (TOS, β strand and amphipathic α helix marked). 32P incorporation plotted as a fraction of the zero PRAS40 reaction of each series, with IC50 curves and values as indicated. Means shown as dashes and values from independent experiments shown with indicated markers and colors (n=3; PRAS40173–256 n=5). b, Close-up view of PRAS40 α helix–FRB interface. 3.4 Å mFo-dFc electron density before PRAS40 was built (blue, 1.8 σ), and anomalous diffraction map (red, 3.5 σ) of SeMet-PRAS40 crystals also shown. c, PRAS40 α helix–FRB interface of b superimposed on FRB (purple)-S6K1 peptide (cyan), highlighting PRAS40 Met222 and S6K1 Leu396. d, Close-up view of PRAS40 β strand–mLST8 interface. 3.4 Å mFo-dFc electron density (blue, 2.0 σ) before PRAS40 was built also shown. e, Inhibition of 20 nM mTORC1 phosphorylating full-length 4EBP1 (5 μM) by w.t. or mutant full-length PRAS40. Quantified and plotted as in a (n=4).
Figure 4
Figure 4. Cryo-EM structure of RHEB-mTORC1
a, One copy of the RHEB-mTOR-RAPTOR-mLST8-4EBP1 complex. mTOR colored according to linear schematic (hatched blue box, extension of conventional FAT boundary), RHEB red, RAPTOR purple, mLST8 green, 4EBP1 TOS magenta. AMPPNP-Mg2+ and GTPγS-Mg2+ in CPK representation (dotted lines, disordered N-heat–M-heat and M-heat–FAT linkers). b, Dimeric mTORC1 oriented similarly to a (top) and rotated as shown (bottom). The two mTOR are cyan and orange, and the other subunits as in a. c, RHEB-GTPγS interface with mTOR N-heat, M-heat and FAT, showing side chains and backbone groups within inter- and intra-molecular contact distance. RHEB is pink, switch regions dark red. FAT residues 1261–1266 omitted for clarity.
Figure 5
Figure 5. RHEB allosterically activates the kinase
a, Rendering of the inactive (left) and active (right) mTOR structures (colored as in Fig. 4a). Arrows indicate the motions of N-heat, kinase-proximal FAT portion, and N lobe domains. b, Activation of mTORC1 phosphorylating 4EBP1 (10 μM) by RHEB-GTPγS, plotted relative to zero RHEB (means as dashes, three independent experiments as open circles; gel in Extended Data Fig. 8h). Dose-response curve and values also shown. c, FAT-KD portions of active (colored as in a) and inactive (gray) mTOR superimposed on their C lobes. Rotations and their axes (red sticks) and approximate hinge locations (residue numbers) marked. d, Catalytic cleft closure in the inactive-to-active transition. Colored as in c, with orientation rotated ~90° around y (red stick, rotation axis 4 from c). e, Cryo-EM density of the AMPPNP from the 3.4 Å reconstruction of RHEB-mTORC1, looking down vertical axis of f. f, Inactive-to-active transition realigns N lobe residues that contact the ATP relative to the Mg2+ ligands and catalytic residues on the C lobe. g, Steady-state kinetic analysis of mTORC1 phosphorylating S6K1367–404 in presence of 250 μM RHEB-GDP (blue plot) or RHEB-GTPγS (red plot). Data of Extended Data Fig. 8i plotted with means as dashes and values from three independent experiments with indicated markers and colors. KM and kcat values and simulated curves also shown.
Figure 6
Figure 6. Hyperactivating mutations mimic RHEB’s effects
a, Thirty-four cancer-associated hyperactivating mTOR mutations, mapped onto apo-mTORC1 FAT-KD portion, colored as in Figure 4a (thick red sticks, mutated residues; assayed mutants labeled). b, RHEB-GTPγS activating S6K1367–404 (150 μM) phosphorylation by w.t. or indicated mutant mTORC1 (10 nM). Plotted with means as dashes and individual values from three independent experiments with indicated markers and colors. Dose response curves and coefficients also shown.

Comment in

References

    1. Ben-Sahra I, Manning BD. mTORC1 signaling and the metabolic control of cell growth. Current opinion in cell biology. 2017;45:72–82. - PMC - PubMed
    1. Bar-Peled L, Sabatini DM. Regulation of mTORC1 by amino acids. Trends in cell biology. 2014;24:400–406. - PMC - PubMed
    1. Dibble CC, Cantley LC. Regulation of mTORC1 by PI3K signaling. Trends in cell biology. 2015;25:545–555. - PMC - PubMed
    1. Laplante M, Sabatini DM. mTOR signaling in growth control and disease. Cell. 2012;149:274–293. - PMC - PubMed
    1. Grabiner BC, et al. A diverse array of cancer-associated MTOR mutations are hyperactivating and can predict rapamycin sensitivity. Cancer discovery. 2014;4:554–563. - PMC - PubMed

Extended Data References

    1. Yang H, et al. mTOR kinase structure, mechanism and regulation. Nature. 2013;497:217–223. - PMC - PubMed
    1. Choi J, Chen J, Schreiber SL, Clardy J. Structure of the FKBP12-rapamycin complex interacting with the binding domain of human FRAP. Science. 1996;273:239–242. - PubMed
    1. Baker NA, Sept D, Joseph S, Holst MJ, McCammon JA. Electrostatics of nanosystems: application to microtubules and the ribosome. Proc Natl Acad Sci U S A. 2001;98:10037–10041. - PMC - PubMed
    1. Brown A, et al. Tools for macromolecular model building and refinement into electron cryo-microscopy reconstructions. Acta Crystallogr D Biol Crystallogr. 2015;71:136–153. - PMC - PubMed
    1. Kim DH, et al. mTOR interacts with raptor to form a nutrient-sensitive complex that signals to the cell growth machinery. Cell. 2002;110:163–175. - PubMed

Publication types

MeSH terms

Substances