. 2018 Feb 22;131(8):899-910.
doi: 10.1182/blood-2017-05-786590. Epub 2017 Dec 13.

Structure-function analysis of ferroportin defines the binding site and an alternative mechanism of action of hepcidin

Affiliations

Structure-function analysis of ferroportin defines the binding site and an alternative mechanism of action of hepcidin

Sharraya Aschemeyer et al. Blood. .

Abstract

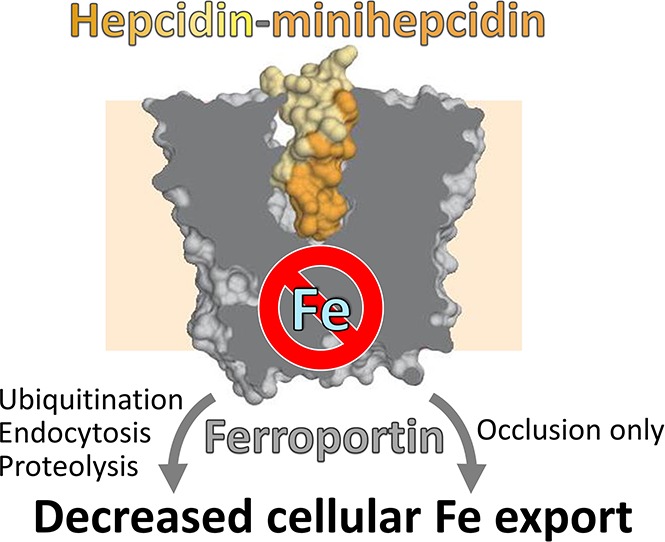
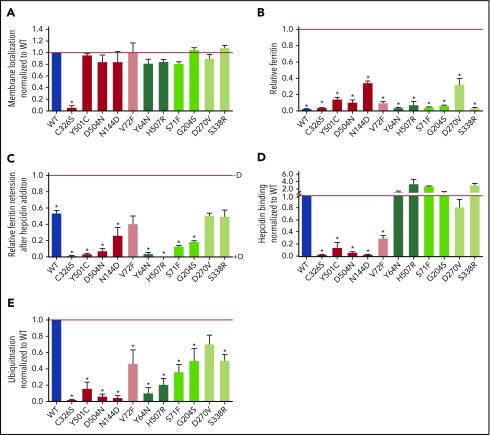
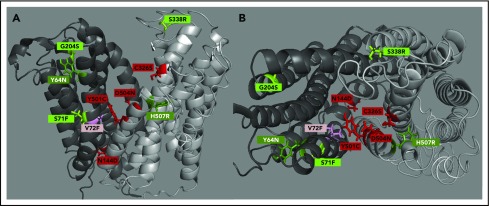
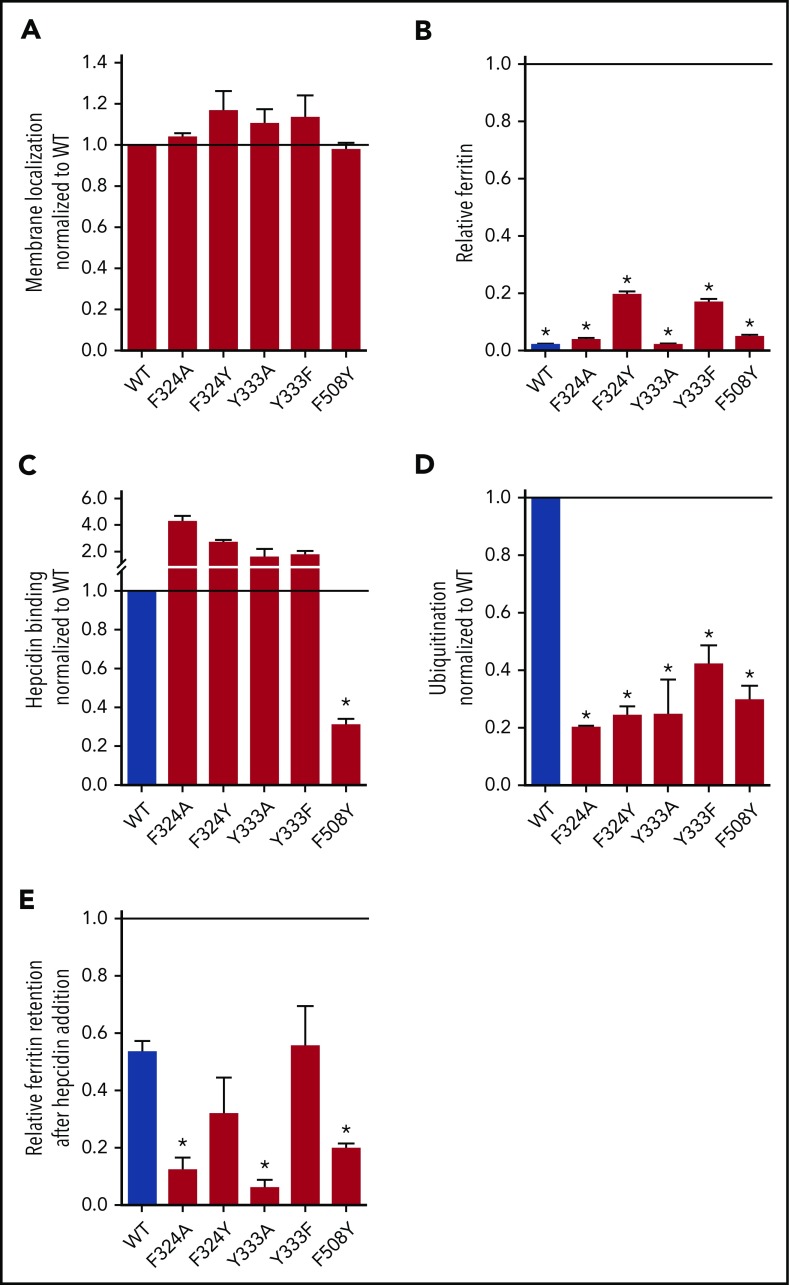
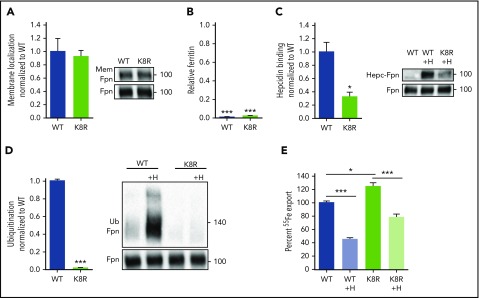
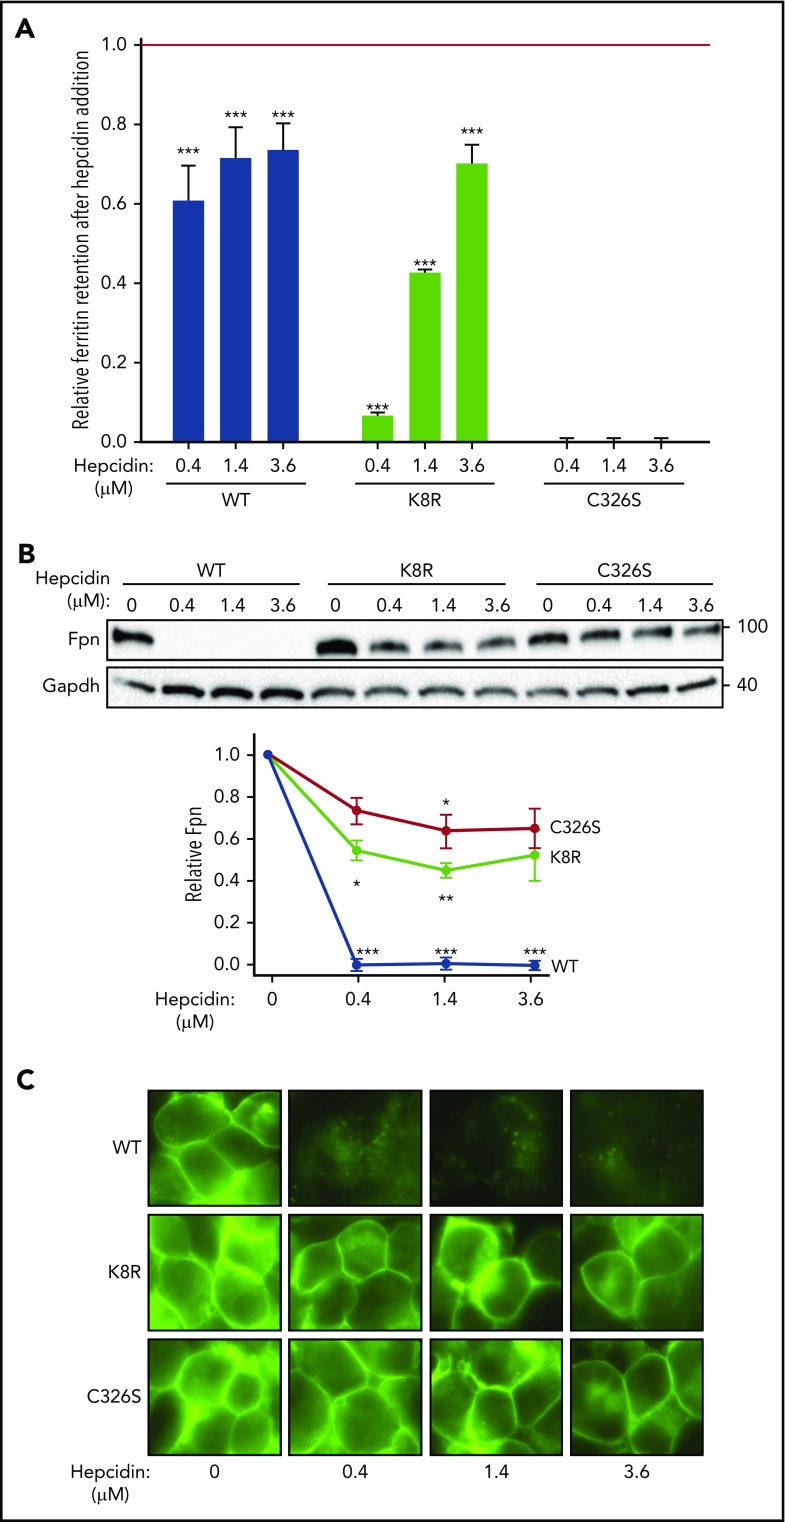
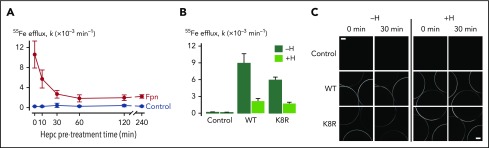
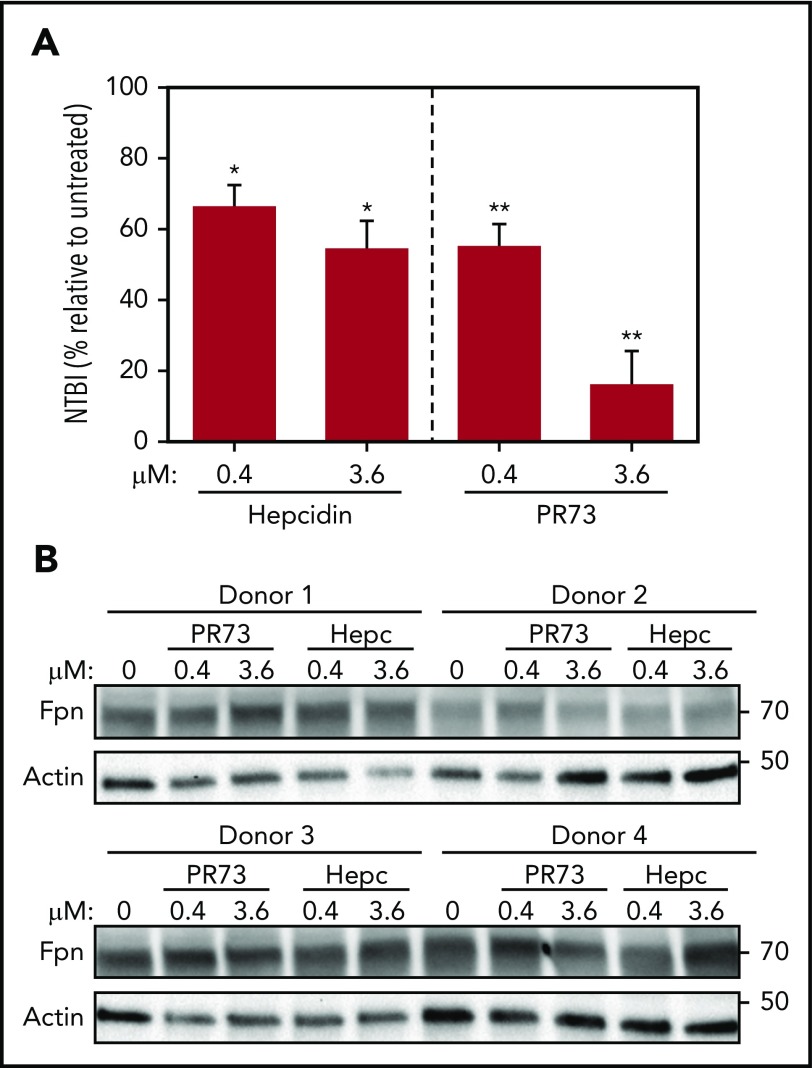
Nonclassical ferroportin disease (FD) is a form of hereditary hemochromatosis caused by mutations in the iron transporter ferroportin (Fpn), resulting in parenchymal iron overload. Fpn is regulated by the hormone hepcidin, which induces Fpn endocytosis and cellular iron retention. We characterized 11 clinically relevant and 5 nonclinical Fpn mutations using stably transfected, inducible isogenic cell lines. All clinical mutants were functionally resistant to hepcidin as a consequence of either impaired hepcidin binding or impaired hepcidin-dependent ubiquitination despite intact hepcidin binding. Mapping the residues onto 2 computational models of the human Fpn structure indicated that (1) mutations that caused ubiquitination-resistance were positioned at helix-helix interfaces, likely preventing the hepcidin-induced conformational change, (2) hepcidin binding occurred within the central cavity of Fpn, (3) hepcidin interacted with up to 4 helices, and (4) hepcidin binding should occlude Fpn and interfere with iron export independently of endocytosis. We experimentally confirmed hepcidin-mediated occlusion of Fpn in the absence of endocytosis in multiple cellular systems: HEK293 cells expressing an endocytosis-defective Fpn mutant (K8R), Xenopus oocytes expressing wild-type or K8R Fpn, and mature human red blood cells. We conclude that nonclassical FD is caused by Fpn mutations that decrease hepcidin binding or hinder conformational changes required for ubiquitination and endocytosis of Fpn. The newly documented ability of hepcidin and its agonists to occlude iron transport may facilitate the development of broadly effective treatments for hereditary iron overload disorders.


Conflict of interest statement

Conflict-of-interest disclosure: E.N. and T.G. are consultants and shareholders of Intrinsic LifeSciences and Silarus Therapeutics and consultants for La Jolla Pharmaceuticals. T.G. is a consultant for Keryx Pharmaceuticals. B.M. is a recipient of a Vifor Pharma grant. S.R. is a member of the scientific advisory board and the recipient of a grant from Ionis Pharmaceuticals. The remaining authors declare no competing financial interests.

Figures

None
Graphical abstract
Figure 1.
Figure 1.
Fpn mutants have either impaired hepcidin binding or intact hepcidin binding but impaired hepcidin-dependent ubiquitination, leading to varying hepcidin resistance. (A) HEK293T cells stably transfected with hFpn-GFP mutants or WT were induced with dox (+D) to express Fpn, surface-thiol biotinylated for 30 minutes, immunoprecipitated with anti-GFP antibody (Ab), and immunoblotted with streptavidin-HRP or anti-GFP Ab. Band intensity was normalized to total GFP and then further normalized to WT Fpn on each blot. Because mutant data within each western blot were normalized to the WT sample on the same blot, the WT value is always 1 and is without error bars. WT is included in the graph only for visual reference. (B) hFpn-GFP mutants were induced overnight with dox and then incubated for 24 hours in the presence of 25 μM ferric ammonium citrate (FAC). The intracellular ferritin concentration was normalized to the total protein concentration. Ferritin was normalized to the uninduced sample (−D) for each cell line (uninduced = 1). Data shown are means ± standard errors of the means of 3 to 5 independent experiments. For statistical analysis, the 2-tailed 1-sample Student t test (normally distributed data) or the 2-tailed 1-sample signed rank test (data with nonnormal distribution) was used with 1 as the comparison. The false discovery rate (FDR) procedure was used to determine significance (*significant). (C) Expression of WT and mutant hFpn-GFP was induced overnight or not, and cells were then incubated for 24 hours with 25 μM FAC ± 1 µg/ml (0.4 µM) hepcidin. The intracellular ferritin concentration was normalized to the total protein concentration and expressed relative to uninduced cells (ie, maximal ferritin levels for each mutant, −dox). (D) HEK293T cells expressing WT and mutant hFpn-GFP were treated with N-terminally biotinylated hepcidin for 30 minutes, immunoprecipitated with anti-GFP Ab, run under nonreducing conditions, and immunoblotted with streptavidin-HRP or anti-GFP Abs. The streptavidin signal was first normalized to total GFP, and then mutant hepcidin binding values were expressed as a fraction of hepcidin binding to WT Fpn. Because mutant data within each western blot were normalized to the WT sample on the same blot, the WT value is always 1 and is without error bars. WT is included in the graph only for visual reference. (E) Fpn-GFP WT and mutants were treated with hepcidin for 30 minutes, immunoprecipitated with anti-GFP Ab, and immunoblotted with anti–poly-/monoubiquitin (FK2) Ab or anti-GFP Ab. The ubiquitination signal was first normalized to the GFP signal, and then the mutant ubiquitination was expressed as a fraction of WT Fpn ubiquitination. As in panel B, WT is included only for visual reference. For statistical analysis in panels B and C, the 2-tailed 1-sample Student t test was used wtih 1 as the comparison, and for panel A, the 2-tailed Student t test (normally distributed data) or the Mann-Whitney rank sum test (data with nonnormal distribution) was used with WT as the comparison. After the P values were obtained, the FDR procedure was used to determine significance (*significant). Data shown are means ± standard errors of the means of 3 to 6 independent experiments. Hepcidin-binding mutants are denoted by red shades and ubiquitination mutants by green shades. Severely impaired mutants are denoted by bolder colors. Severe impairment was defined as ≤25% of WT values based on assessing the values from panels C-E for mutants with impaired hepcidin binding and panels C and E for impaired hepcidin-induced conformational change mutants. Also, for panels A-E, red and dark green indicate severe mutations, medium green indicates mild mutation, and pink and light green indicates borderline mutations.
Figure 2.
Figure 2.
hFpn structure depicting clinically relevant mutant residues. (A) A side view of hFpn in its outward-facing state, with the N-terminus on the left and C-terminus on the right. (B) A top-down view of hFpn in its outward-facing state. D270V is not modeled because it is located in the unstructured intracellular loop of Fpn. The red/pink color denotes mutants with impaired hepcidin binding, and the green color denotes mutants with intact hepcidin binding, but variably impaired hepcidin-dependent ubiquitination. For simplicity, the mild and borderline mutants are labeled with the same light color.
Figure 3.
Figure 3.
Analysis of nonclinical hFpn-GFP mutants. Cells expressing inducible nonclinical Fpn mutants were analyzed with the same approaches as those expressing clinical mutants. (A) All mutants were displayed on the cell membrane. Membrane localization was determined as in Figure 1A. (B) All mutants exported iron. Ferritin was determined as in Figure 1B by normalizing it to the uninduced (−dox) condition for each cell line (thus, uninduced ferritin levels = 1). (C) Hepcidin binding was determined as in Figure 1D. (D) Ubiquitination was determined as in Figure 1E. (E) Relative ferritin retention after hepcidin addition was determined as in Figure 1C. Data shown are means ± standard errors of the means of 3 to 6 independent experiments. For statistical analysis the 2-tailed 1-sample Student t test was used with 1 as the comparison for panels A-D, and the 2-tailed Student t test (normally distributed data) or the Mann-Whitney rank sum test (data with nonnormal distribution) was used with WT as the comparison for panel E. After the P values were obtained, the FDR procedure was used to determine significance (*significant).
Figure 4.
Figure 4.
Iron export by the K8R mutant is inhibited by hepcidin despite the absence of ligand-induced ubiquitination. (A) Cells were treated as in Figure 1A. K8R localized to the cell membrane similarly to WT. (B) Cells were treated as in Figure 1B. K8R exported iron and decreased ferritin similarly to WT. For statistical analysis, the 1-sample Student t test with 1 as the comparison (normally distributed data) or the 1-sample signed rank test (data with nonnormal distribution) was used. (C) HEK293T cells expressing WT and mutant Fpn-GFP were treated with N-terminally biotinylated hepcidin for 30 minutes, immunoprecipitated with anti-GFP Ab, run under nonreducing conditions, and immunoblotted with streptavidin-HRP or anti-GFP Abs. Hepcidin bound less to K8R compared with WT. (D) Cells were treated as in Figure 1E. The K8R mutant was not ubiquitinated after hepcidin addition. For the statistical analysis in panels A, C, and D, the 2-tailed Student t test was used with WT as the comparison. (E) Cells were loaded with 2 mM 55Fe-NTA for 48 hours, washed, replated, induced overnight, washed again, and then ±3 μg/ml hepcidin was added. Extracellular radioactivity was measured at 0, 2, 4, and 8 hours. The “uninduced” measurement at each time point was subtracted as background, and the slope for each sample was determined and used to calculate the percentage of iron export by normalizing the slopes to the untreated WT. For the statistical analysis in panel E, the 2-tailed Student t test (normally distributed data) and Mann-Whitney rank sum test (data with nonnormal distribution) were used with WT as the comparison. Data shown are means ± standard errors of the means of 3 to 4 biological replicates. ***P < .001; **P < .01; *P < .05. Hepc-Fpn, hepcidin complexed with Fpn; Mem, membrane.
Figure 5.
Figure 5.
Evidence for Fpn occlusion by hepcidin. Cells expressing inducible nonubiquitinating K8R mutant were compared with those expressing WT Fpn or C326S mutant, which does not bind hepcidin. (A) Ferritin retention after hepcidin addition was determined as in Figure 1C. For the statistical analysis the 2-tailed Student t test was used with the respective untreated control for comparison. ***P < .001; **P < .01; *P < .05. (B) Lysates from panel A were analyzed by western blotting. Top: representative western blot. Bottom: densitometry of triplicate western blots. The Fpn signal was first normalized to glyceraldehyde-3-phosphate dehydrogenase, then expressed as a fraction of its respective untreated control (no hepcidin treatment). For the statistical analysis, the 2-tailed 1-sample Student t test was used with 1 as the comparison. ***P < .001; **P < .01; *P < .05. C) Microscopy of live cells from panel A after 24 hours (original magnification ×40). Data shown are the mean ± standard errors of the mean of 3 independent experiments.
Figure 6.
Figure 6.
Effect of hepcidin on WT and mutant Fpn expressed in Xenopus oocytes. (A) First-order rate constants (k) describing 55Fe efflux (assayed over 30 minutes) from control oocytes (gray) and oocytes expressing WT Fpn (black) pretreated with 10 µM hepcidin for 0 to 240 minutes (n = 8-12 per group). Two-way analysis of variance (ANOVA) revealed an interaction (P < .001); within Fpn, the 0- and 10-minute time points differed from all other time points (P < .001), and the 30- to 240-minute time points did not differ from one another (P ≥ .35). (B) 55Fe efflux in control oocytes and oocytes expressing WT or K8R Fpn that were untreated (−H) or pretreated for 30 minutes with 10 µM hepcidin (+H) (n = 9-12 per group). Two-way ANOVA revealed an interaction (P < .001). Percent inhibition of 55Fe efflux by hepcidin did not differ between WT (76% ± 6%) and K8R (71% ± 3%) (means ± standard errors of the means) (P = .47). (C) Live-cell imaging of control oocytes and oocytes expressing WT or K8R Fpn before and after 30 minutes of treatment without hepcidin (−H) or with 10 µM hepcidin (+H) in the same oocyte preparation as used in panel B. Each frame captures portions of 3 oocytes, and the image plane approximately bisects the oocytes. Scale bars, 0.2 mm. Two-way ANOVA of the change in fluorescence intensity (ΔF) over time revealed a greater loss of fluorescence in untreated oocytes (−H) compared with hepcidin-treated (+H) (P = .005) and that ΔF did not differ between WT and K8R (P = .75).
Figure 7.
Figure 7.
Hepcidin blocks iron export from human RBCs without degrading Fpn. Human PRBCs from 4 different donors were treated with hepcidin or PR73 for 24 hours at 37°C. (A) Iron export from PRBCs was assessed by measuring NTBI in the medium. For the statistical analysis, the 2-tailed 1-sample Student t test was used with 100% as the comparison. (B) Western blotting of Fpn and actin levels in PBRCs.

Comment in

References

    1. Drakesmith H, Nemeth E, Ganz T. Ironing out ferroportin. Cell Metab. 2015;22(5):777-787. - PMC - PubMed
    1. Nemeth E, Tuttle MS, Powelson J, et al. . Hepcidin regulates cellular iron efflux by binding to ferroportin and inducing its internalization. Science. 2004;306(5704):2090-2093. - PubMed
    1. Qiao B, Sugianto P, Fung E, et al. . Hepcidin-induced endocytosis of ferroportin is dependent on ferroportin ubiquitination. Cell Metab. 2012;15(6):918-924. - PMC - PubMed
    1. Preza GC, Pinon R, Ganz T, Nemeth E. Cellular catabolism of the iron-regulatory peptide hormone hepcidin. PLoS One. 2013;8(3):e58934. - PMC - PubMed
    1. De Falco L, Sanchez M, Silvestri L, et al. . Iron refractory iron deficiency anemia. Haematologica. 2013;98(6):845-853. - PMC - PubMed

Publication types

MeSH terms