Individual differences in normal body temperature: longitudinal big data analysis of patient records
- PMID: 29237616
- PMCID: PMC5727437
- DOI: 10.1136/bmj.j5468
Individual differences in normal body temperature: longitudinal big data analysis of patient records
Abstract
Objective: To estimate individual level body temperature and to correlate it with other measures of physiology and health.
Design: Observational cohort study.
Setting: Outpatient clinics of a large academic hospital, 2009-14.
Participants: 35 488 patients who neither received a diagnosis for infections nor were prescribed antibiotics, in whom temperature was expected to be within normal limits.
Main outcome measures: Baseline temperatures at individual level, estimated using random effects regression and controlling for ambient conditions at the time of measurement, body site, and time factors. Baseline temperatures were correlated with demographics, medical comorbidities, vital signs, and subsequent one year mortality.
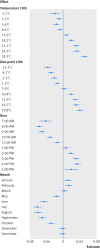
Results: In a diverse cohort of 35 488 patients (mean age 52.9 years, 64% women, 41% non-white race) with 243 506 temperature measurements, mean temperature was 36.6°C (95% range 35.7-37.3°C, 99% range 35.3-37.7°C). Several demographic factors were linked to individual level temperature, with older people the coolest (-0.021°C for every decade, P<0.001) and African-American women the hottest (versus white men: 0.052°C, P<0.001). Several comorbidities were linked to lower temperature (eg, hypothyroidism: -0.013°C, P=0.01) or higher temperature (eg, cancer: 0.020, P<0.001), as were physiological measurements (eg, body mass index: 0.002 per m/kg2, P<0.001). Overall, measured factors collectively explained only 8.2% of individual temperature variation. Despite this, unexplained temperature variation was a significant predictor of subsequent mortality: controlling for all measured factors, an increase of 0.149°C (1 SD of individual temperature in the data) was linked to 8.4% higher one year mortality (P=0.014).
Conclusions: Individuals' baseline temperatures showed meaningful variation that was not due solely to measurement error or environmental factors. Baseline temperatures correlated with demographics, comorbid conditions, and physiology, but these factors explained only a small part of individual temperature variation. Unexplained variation in baseline temperature, however, strongly predicted mortality.
Published by the BMJ Publishing Group Limited. For permission to use (where not already granted under a licence) please go to http://group.bmj.com/group/rights-licensing/permissions.
Conflict of interest statement
Competing interests: All authors have completed the ICMJE uniform disclosure form at www.icmje.org/coi_disclosure.pdf and declare: no financial relationships with any organizations that might have an interest in the submitted work in the previous three years; no other relationships or activities that could appear to have influenced the submitted work.
Figures


Comment in
-
Feel the heat: a short history of body temperature.BMJ. 2017 Dec 13;359:j5697. doi: 10.1136/bmj.j5697. BMJ. 2017. PMID: 29237591 No abstract available.
-
Not so hot: US data suggest human bodies are cooling down.Nature. 2020 Jan;577(7790):306. doi: 10.1038/d41586-020-00074-9. Nature. 2020. PMID: 31937972 No abstract available.
References
Publication types
MeSH terms
Grants and funding
LinkOut - more resources
Full Text Sources
Other Literature Sources
