

A novel linkage-disequilibrium corrected genomic relationship matrix for SNP-heritability estimation and genomic prediction
- PMID: 29238077
- PMCID: PMC5842222
- DOI: 10.1038/s41437-017-0023-4
A novel linkage-disequilibrium corrected genomic relationship matrix for SNP-heritability estimation and genomic prediction
Abstract
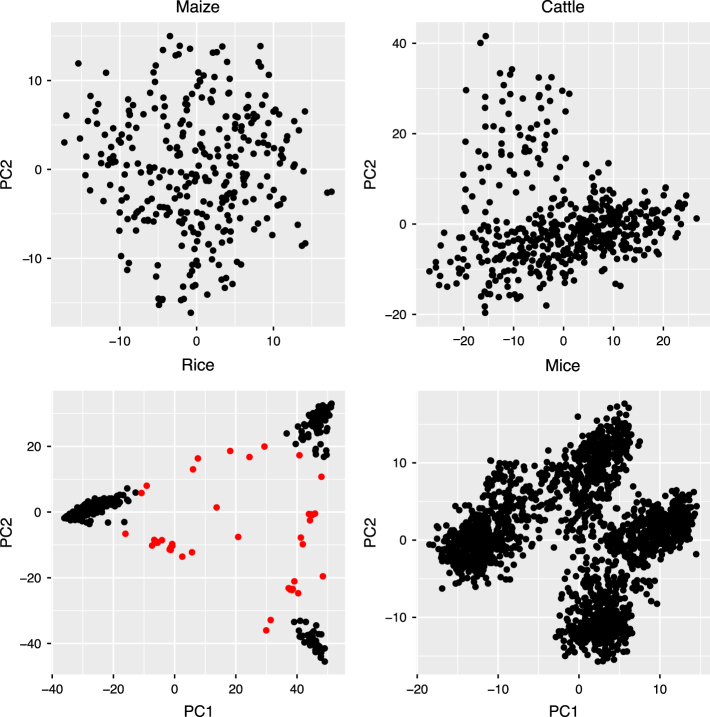
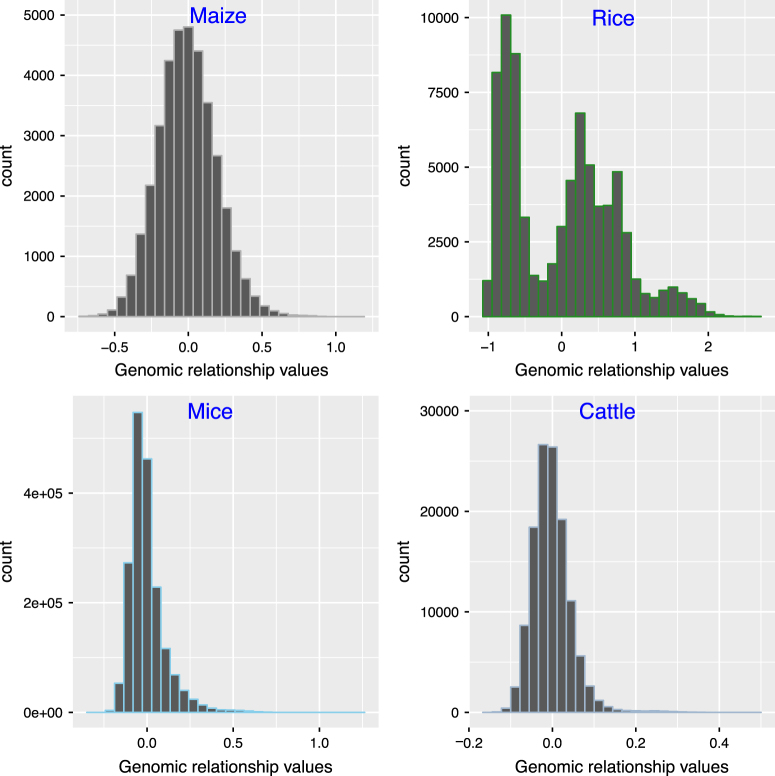
Single nucleotide polymorphism (SNP)-heritability estimation is an important topic in several research fields, including animal, plant and human genetics, as well as in ecology. Linear mixed model estimation of SNP-heritability uses the structures of genomic relationships between individuals, which is constructed from genome-wide sets of SNP-markers that are generally weighted equally in their contributions. Proposed methods to handle dependence between SNPs include, "thinning" the marker set by linkage disequilibrium (LD)-pruning, the use of haplotype-tagging of SNPs, and LD-weighting of the SNP-contributions. For improved estimation, we propose a new conceptual framework for genomic relationship matrix, in which Mahalanobis distance-based LD-correction is used in a linear mixed model estimation of SNP-heritability. The superiority of the presented method is illustrated and compared to mixed-model analyses using a VanRaden genomic relationship matrix, a matrix used by GCTA and a matrix employing LD-weighting (as implemented in the LDAK software) in simulated (using real human, rice and cattle genotypes) and real (maize, rice and mice) datasets. Despite of the computational difficulties, our results suggest that by using the proposed method one can improve the accuracy of SNP-heritability estimates in datasets with high LD.
Conflict of interest statement
The authors declare that they have no competing interests.
Figures
Similar articles
-
Impact of linkage disequilibrium heterogeneity along the genome on genomic prediction and heritability estimation.Genet Sel Evol. 2022 Jun 27;54(1):47. doi: 10.1186/s12711-022-00737-3. Genet Sel Evol. 2022. PMID: 35761182 Free PMC article.
-
Accuracy of Genomic Prediction in Synthetic Populations Depending on the Number of Parents, Relatedness, and Ancestral Linkage Disequilibrium.Genetics. 2017 Jan;205(1):441-454. doi: 10.1534/genetics.116.193243. Epub 2016 Nov 9. Genetics. 2017. PMID: 28049710 Free PMC article.
-
Using selection index theory to estimate consistency of multi-locus linkage disequilibrium across populations.BMC Genet. 2015 Jul 19;16:87. doi: 10.1186/s12863-015-0252-6. BMC Genet. 2015. PMID: 26187501 Free PMC article.
-
Software for tag single nucleotide polymorphism selection.Hum Genomics. 2005 Jun;2(2):144-51. doi: 10.1186/1479-7364-2-2-144. Hum Genomics. 2005. PMID: 16004730 Free PMC article. Review.
-
Fully exploiting SNP arrays: a systematic review on the tools to extract underlying genomic structure.Brief Bioinform. 2022 Mar 10;23(2):bbac043. doi: 10.1093/bib/bbac043. Brief Bioinform. 2022. PMID: 35211719 Free PMC article.
Cited by
-
Efficient weighting methods for genomic best linear-unbiased prediction (BLUP) adapted to the genetic architectures of quantitative traits.Heredity (Edinb). 2021 Feb;126(2):320-334. doi: 10.1038/s41437-020-00372-y. Epub 2020 Sep 26. Heredity (Edinb). 2021. PMID: 32980863 Free PMC article.
-
PHARP: a pig haplotype reference panel for genotype imputation.Sci Rep. 2022 Jul 25;12(1):12645. doi: 10.1038/s41598-022-15851-x. Sci Rep. 2022. PMID: 35879321 Free PMC article.
-
Advancing crop improvement through GWAS and beyond in mung bean.Front Plant Sci. 2024 Dec 18;15:1436532. doi: 10.3389/fpls.2024.1436532. eCollection 2024. Front Plant Sci. 2024. PMID: 39744597 Free PMC article.
-
Impact of linkage disequilibrium heterogeneity along the genome on genomic prediction and heritability estimation.Genet Sel Evol. 2022 Jun 27;54(1):47. doi: 10.1186/s12711-022-00737-3. Genet Sel Evol. 2022. PMID: 35761182 Free PMC article.
-
Local and Bayesian Survival FDR Estimations to Identify Reliable Associations in Whole Genome of Bread Wheat.Int J Mol Sci. 2023 Sep 12;24(18):14011. doi: 10.3390/ijms241814011. Int J Mol Sci. 2023. PMID: 37762314 Free PMC article.
References
-
- Bhatia G. et al. Haplotypes of common SNPs can explain missing heritability of complex diseases. Preprint at bioRxiv 10.1101/022418 (2016)
MeSH terms
LinkOut - more resources
Full Text Sources
Other Literature Sources
Research Materials
