. 2017 Nov 29:8:2022.
doi: 10.3389/fpls.2017.02022. eCollection 2017.

Rhizosphere Microbiome Recruited from a Suppressive Compost Improves Plant Fitness and Increases Protection against Vascular Wilt Pathogens of Tomato

Affiliations

Rhizosphere Microbiome Recruited from a Suppressive Compost Improves Plant Fitness and Increases Protection against Vascular Wilt Pathogens of Tomato

Anastasis Antoniou et al. Front Plant Sci. .

Abstract

Suppressive composts represent a sustainable approach to combat soilborne plant pathogens and an alternative to the ineffective chemical fungicides used against those. Nevertheless, suppressiveness to plant pathogens and reliability of composts are often inconsistent with unpredictable effects. While suppressiveness is usually attributed to the compost's microorganisms, the mechanisms governing microbial recruitment by the roots and the composition of selected microbial communities are not fully elucidated. Herein, the purpose of the study was to evaluate the impact of a compost on tomato plant growth and its suppressiveness against Fusarium oxysporum f. sp. lycopersici (Foxl) and Verticillium dahliae (Vd). First, growth parameters of tomato plants grown in sterile peat-based substrates including 20 and 30% sterile compost (80P/20C-ST and 70P/30C-ST) or non-sterile compost (80P/20C and 70P/30C) were evaluated in a growth room experiment. Plant height, total leaf surface, and fresh and dry weight of plants grown in the non-sterile compost mixes were increased compared to the plants grown in the sterile compost substrates, indicating the plant growth promoting activity of the compost's microorganisms. Subsequently, compost's suppressiveness against Foxl and Vd was evaluated with pathogenicity experiments on tomato plants grown in 70P/30C-ST and 70P/30C substrates. Disease intensity was significantly less in plants grown in the non-sterile compost than in those grown in the sterile compost substrate; AUDPC was 2.3- and 1.4-fold less for Foxl and Vd, respectively. Moreover, fungal quantification in planta demonstrated reduced colonization in plants grown in the non-sterile mixture. To further investigate these findings, we characterized the culturable microbiome attracted by the roots compared to the unplanted compost. Bacteria and fungi isolated from unplanted compost and the rhizosphere of plants were sequence-identified. Community-level analysis revealed differential microbial communities between the compost and the rhizosphere, suggesting a clear effect of the plant in the microbiome assembly. Proteobacteria and Actinobacteria were highly enriched in the rhizosphere whereas Firmicutes were strongly represented in both compartments with Bacillus being the most abundant species. Our results shed light on the composition of a microbial consortium that could protect plants against the wilt pathogens of tomato and improve plant overall health.

Keywords: Fusarium oxysporum; Verticillium dahliae; compost; disease suppression; microbiome; plant growth promotion; rhizosphere.


Figures
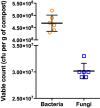
FIGURE 1
FIGURE 1
Scatter plot and mean ± SD of CFU of bacteria and fungi after 48 and 72 h incubation at 25°C, respectively. The values are plotted as CFU per gram of compost. Circles and squares represent raw data of six replicates for bacteria and fungi, respectively.
FIGURE 2
FIGURE 2
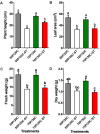
Effect of potting mixes consisting of peat and compost on plant growth of tomato plants. Data are means of 10 biological replicates. Error bars represent SE. Different letters represent statistically significant differences between treatments (one-way ANOVA, Tukey’s test; P < 0.05). (A) Plant height (in cm). (B) Leaf area (in cm2). (C) Fresh weight of plants (in g). (D) Dry weight (in g).
FIGURE 3
FIGURE 3
Verticillium wilt disease severity on tomato plants inoculated with Verticillium dahliae and fungal biomass quantification in planta. (A) Disease severity at each observation was calculated by the number of leaves that showed wilting as a percentage of the total number of leaves of each plant. Each treatment consisted of 10 plants and the experiment was repeated three times with similar results. Vertical bars indicate the standard error of mean. (B) Disease ratings were plotted over time to generate disease progress curves; subsequently, the area under the disease progress curve (AUDPC) was calculated by the trapezoidal integration method. Columns with different letters are statistically significantly different according to Tukey’s multiple range test at P < 0.05. (C) Quantification of fungal biomass in planta was performed by real-time qPCR using total plant DNA isolated from the aboveground parts of plants, sampled at 5, 10, 15, and 20 days post-inoculation (dpi). Data are means of 15 plants and error bars indicate SE. Statistically significant differences are indicated as P < 0.05 and ∗∗∗∗P < 0.0001 (two-way ANOVA, Sidak’s test). (D) Verticillium wilt symptoms on tomato plants grown in the non-sterilized (Left) and in the sterile mix (Right) at 15 dpi.
FIGURE 4
FIGURE 4
Fusarium wilt disease severity on tomato plants inoculated with F. oxysporum f. sp. lycopersici and fungal biomass quantification in planta. (A) Disease severity at each observation was calculated by the number of leaves that showed wilting as a percentage of the total number of leaves of each plant. Each treatment consisted of 10 plants and the experiment was repeated three times with similar results. Vertical bars indicate the standard error of mean. (B) Disease ratings were plotted over time to generate disease progress curves; subsequently, the AUDPC was calculated by the trapezoidal integration method. Columns with different letters are statistically significantly different according to Tukey’s multiple range test at P < 0.05. (C) Quantification of fungal biomass in planta was performed by real-time qPCR using total plant DNA isolated from the aboveground parts of plants, sampled at 5, 10, 15, and 20 dpi. Data are means of 15 plants and error bars indicate SE. Statistically significant differences are indicated as P < 0.05 and ∗∗∗∗P < 0.0001 (two-way ANOVA, Sidak’s test). (D) Fusarium wilt symptoms on tomato plants grown in the non-sterilized (Left) and in the sterile mix (Right) at 15 dpi.
FIGURE 5
FIGURE 5
Distribution of phyla is altered between the two compartments. Bar plot showing the relative abundance of phyla where the isolated bacteria and fungi are classified. Relative abundance was calculated for each culturable microbe dividing the times it was isolated in each sample with the total number of isolated microbes in this sample (total sum normalization). Different colors correspond to different phyla and segment sizes of stacked bars are proportional to the relative abundance of the phyla (comp1, comp2, comp3 = compost; root1, root2, root3 = rhizosphere).
FIGURE 6
FIGURE 6
Pie chart representation of the total cultured (relative abundance) bacteria (A) isolated from the unplanted compost and (B) the rhizosphere of tomato plants.
FIGURE 7
FIGURE 7
Pie chart representation of the total cultured (relative abundance) fungi (A) isolated from the unplanted compost and (B) the rhizosphere of tomato plants.
FIGURE 8
FIGURE 8
Presence of the plant causes changes in the microbial communities of the compost. Principal coordinates analysis (PCoA) with Bray–Curtis dissimilarity distances shows that compost (red circle) and rhizosphere (blue triangle) are clearly separated, suggesting that the compartment explains the highest percentage of the variation between the isolated microbial communities. Number of circles and triangles with same color represent the number of samples per compartment.

References

    1. Angelopoulou D. J., Naska E. J., Paplomatas E. J., Tjamos S. E. (2014). Biological control agents (BCAs) of verticillium wilt: influence of application rates and delivery method on plant protection, triggering of host defence mechanisms and rhizosphere populations of BCAs. Plant Pathol. 63 k1062–1069. 10.1111/ppa.12198 - DOI
    1. Badri D. V., Chaparro J. M., Zhang R., Shen Q., Vivanco J. M. (2013). Application of natural blends of phytochemicals derived from the root exudates of Arabidopsis to the soil reveal that phenolic-related compounds predominantly modulate the soil microbiome. J. Biol. Chem. 288 4502–4512. 10.1074/jbc.M112.433300 - DOI - PMC - PubMed
    1. Badri D. V., Vivanco J. M. (2009). Regulation and function of root exudates. Plant Cell Environ. 32 666–681. 10.1111/j.1365-3040.2009.01926.x - DOI - PubMed
    1. Bai Y., Müller D. B., Srinivas G., Garrido-Oter R., Potthoff E., Rott M., et al. (2015). Functional overlap of the Arabidopsis leaf and root microbiota. Nature 528 364–369. 10.1038/nature16192 - DOI - PubMed
    1. Bais H. P., Weir T. L., Perry L. G., Gilroy S., Vivanco J. M. (2006). The role of root exudates in rhizosphere interactions with plants and other organisms. Annu. Rev. Plant Biol. 57 233–266. 10.1146/annurev.arplant.57.032905.105159 - DOI - PubMed

LinkOut - more resources