. 2017;3(4):92-99.
doi: 10.1007/s41048-017-0043-x. Epub 2017 Nov 4.

Determining the target protein localization in 3D using the combination of FIB-SEM and APEX2

Affiliations

Determining the target protein localization in 3D using the combination of FIB-SEM and APEX2

Yang Shi et al. Biophys Rep. 2017.

Abstract

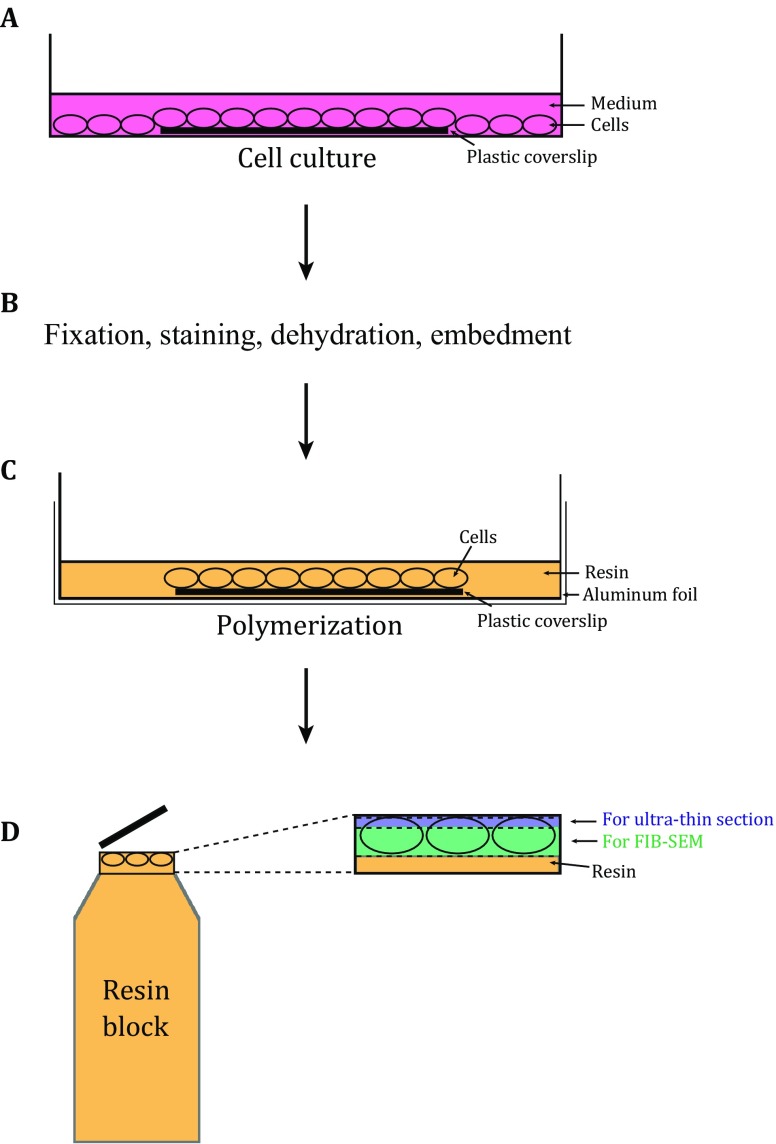
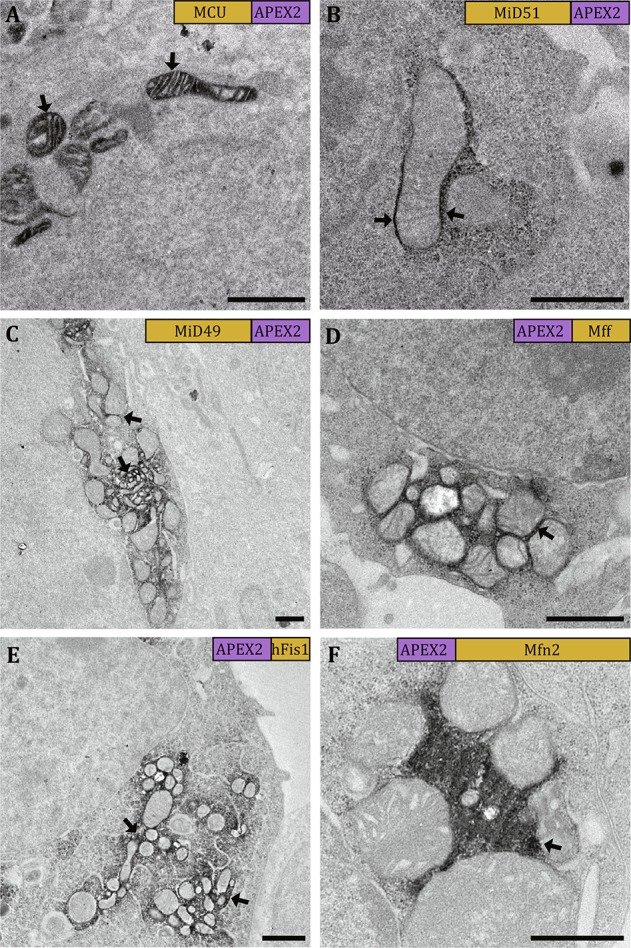
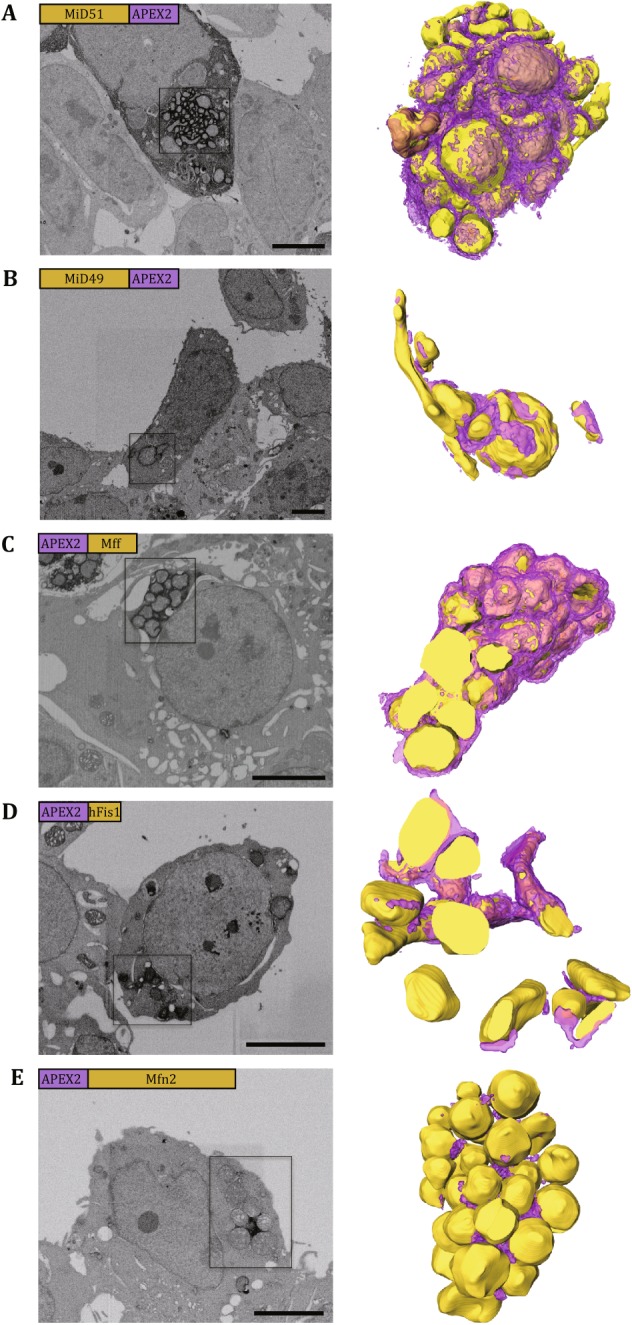
Determining the cellular localization of proteins of interest at nanometer resolution is necessary for elucidating their functions. Besides super-resolution fluorescence microscopy, conventional electron microscopy (EM) combined with immunolabeling or clonable EM tags provides a unique approach to correlate protein localization information and cellular ultrastructural information. However, there are still rare cases of such correlation in three-dimensional (3D) spaces. Here, we developed an approach by combining the focus ion beam scanning electron microscopy (FIB-SEM) and a promising clonable EM tag APEX2 (an enhanced ascorbate peroxidase 2) to determine the target protein localization within 3D cellular ultrastructural context. We further utilized this approach to study the 3D localization of mitochondrial dynamics-related proteins (MiD49/51, Mff, Fis1, and Mfn2) in the cells where the target proteins were overexpressed. We found that all the target proteins were located at the surface of the mitochondrial outer membrane accompanying with mitochondrial clusters. Mid49/51, Mff, and hFis1 spread widely around the mitochondrial surface while Mfn2 only exists at the contact sites.

Keywords: Enhanced ascorbate peroxidase; Focus ion beam scanning electron microscopy; Mitochondrial dynamics; Protein location; Three-dimensional space.


Conflict of interest statement

Compliance with Ethical StandardsYang Shi, Li Wang, Jianguo Zhang, Yujia Zhai, and Fei Sun declare that they have no conflict of interest.This article does not contain any studies with human or animal subjects performed by any of the authors.

Figures

Fig. 1
Fig. 1
The scheme for APEX2–FIB-SEM. A The cells are cultured on sterile plastic coverslips in dishes, and transfected with the target genes fused with APEX2. The cells on the plastic coverslip are used for further EM sample preparation. B The cells on the plastic coverslip undergo fixation, DAB staining, dehydration, and resin embedment. C Before polymerization, the plastic coverslip with cells is transferred to the dish placed with aluminum foil. The cell side of the plastic coverslip is facing up. Fresh resin with accelerator is added to cover the cells. D After polymerization, the block is separated from aluminum foil and plastic coverslip, and the areas with staining patterns are cut off and stuck on the tip of an empty resin block. In order to reserve enough sample for FIB-SEM (colored with green), only three to five slices (less than 80 nm) are sectioned from the block (colored with blue) for TEM screening
Fig. 2
Fig. 2
Visualizing the staining patterns in 2D by TEM. The micrographs show cells expressing MCU-APEX (A), MiD51-APEX2 (B), MiD49-APEX2 (C), APEX2-Mff (D), APEX2-hFis1 (E), and APEX2-Mfn2 (F). The staining areas with strong EM contrast indicate the locations of the target proteins (black arrows). The labels in the top right corner of each micrograph show the relevant position between the target protein and the tag as well as their relevant sizes. Scale bars, 1 μm
Fig. 3
Fig. 3
Visualizing the staining pattern in 3D by FIB-SEM. The figure panels show cells expressing MiD51-APEX2 (A), MiD49-APEX2 (B), APEX2-Mff (C), APEX2-Fis1 (D), and APEX2-Mfn2 (E). The left columns display the representative SEM micrographs from each volume of EM data, and the right columns display the 3D rendering of boxed areas of the left with the yellow spheres for mitochondria and purple layers for APEX2-induced EM contrast. The labels in the top left corner of each micrograph show the relevant position between the target protein and the tag as well as their relevant sizes. Scale bars, 5 μm

References

    1. Adams SR, Campbell RE, Gross LA, Martin BR, Walkup GK, Yao Y, Llopis J, Tsien RY. New biarsenical ligands and tetracysteine motifs for protein labeling in vitro and in vivo: synthesis and biological applications. J Am Chem Soc. 2002;124:6063–6076. doi: 10.1021/ja017687n. - DOI - PubMed
    1. Bruggisser J, Käser S, Mani J, Schneider A. Biogenesis of a mitochondrial outer membrane protein in Trypanosoma brucei: targeting signal and dependence on a unique biogenesis factor. J Biol Chem. 2017;292:3400–3410. doi: 10.1074/jbc.M116.755983. - DOI - PMC - PubMed
    1. Connolly CN, Futter CE, Gibson A, Hopkins CR, Cutler DF. Transport into and out of the Golgi complex studied by transfecting cells with cDNAs encoding horseradish peroxidase. J Cell Biol. 1994;127:641. doi: 10.1083/jcb.127.3.641. - DOI - PMC - PubMed
    1. De Mey J, Moeremans M, Geuens G, Nuydens R, De Brabander M. High resolution light and electron microscopic localization of tubulin with the IGS (immuno gold staining) method. Cell Biol Int Rep. 1981;5:889–899. doi: 10.1016/0309-1651(81)90204-6. - DOI - PubMed
    1. Denk W, Horstmann H. Serial block-face scanning electron microscopy to reconstruct three-dimensional tissue nanostructure. PLoS Biol. 2004;2:e329. doi: 10.1371/journal.pbio.0020329. - DOI - PMC - PubMed

LinkOut - more resources