. 2018 Jun;15(2):338-347.
doi: 10.1007/s10393-017-1293-2. Epub 2017 Dec 13.

Forecasting the 2001 Foot-and-Mouth Disease Epidemic in the UK

Affiliations

Forecasting the 2001 Foot-and-Mouth Disease Epidemic in the UK

David W Shanafelt et al. Ecohealth. 2018 Jun.

Abstract

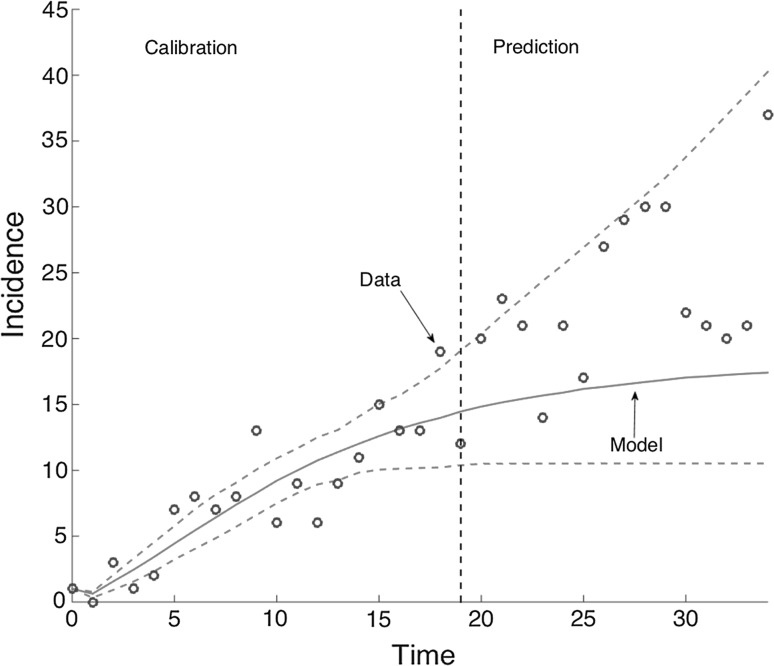
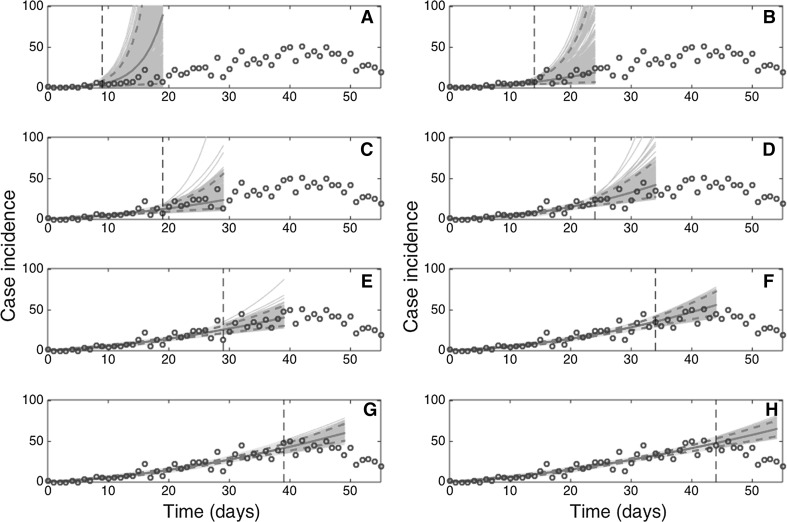
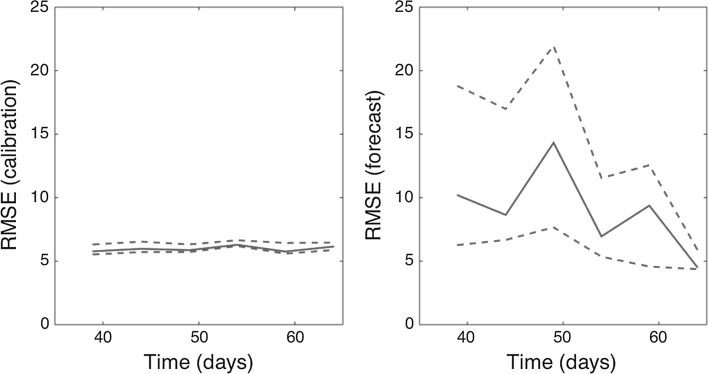
Near real-time epidemic forecasting approaches are needed to respond to the increasing number of infectious disease outbreaks. In this paper, we retrospectively assess the performance of simple phenomenological models that incorporate early sub-exponential growth dynamics to generate short-term forecasts of the 2001 foot-and-mouth disease epidemic in the UK. For this purpose, we employed the generalized-growth model (GGM) for pre-peak predictions and the generalized-Richards model (GRM) for post-peak predictions. The epidemic exhibits a growth-decelerating pattern as the relative growth rate declines inversely with time. The uncertainty of the parameter estimates [Formula: see text] narrows down and becomes more precise using an increasing amount of data of the epidemic growth phase. Indeed, using only the first 10-15 days of the epidemic, the scaling of growth parameter (p) displays wide uncertainty with the confidence interval for p ranging from values ~ 0.5 to 1.0, indicating that less than 15 epidemic days of data are not sufficient to discriminate between sub-exponential (i.e., p < 1) and exponential growth dynamics (i.e., p = 1). By contrast, using 20, 25, or 30 days of epidemic data, it is possible to recover estimates of p around 0.6 and the confidence interval is substantially below the exponential growth regime. Local and national bans on the movement of livestock and a nationwide cull of infected and contiguous premises likely contributed to the decelerating trajectory of the epidemic. The GGM and GRM provided useful 10-day forecasts of the epidemic before and after the peak of the epidemic, respectively. Short-term forecasts improved as the model was calibrated with an increasing length of the epidemic growth phase. Phenomenological models incorporating generalized-growth dynamics are useful tools to generate short-term forecasts of epidemic growth in near real time, particularly in the context of limited epidemiological data as well as information about transmission mechanisms and the effects of control interventions.

Keywords: Epidemic model; Foot-and-mouth disease; Forecasting; Sub-exponential growth.


Figures

Figure 1
Figure 1
a Daily number of new notifications of infected premises during the 2001 foot-and-mouth disease epidemic in the UK and b the relative growth rate of the epidemic decreases inversely with time [see Arim et al. (2006)]. The vertical dashed line indicates the start of market closures on February 22, 2001 (16 days after the first notification), while the vertical solid line indicates the start of national culling policies on March 27, 2001 (49 days after the first notification), which occurred shortly after the epidemic peak.
Figure 2
Figure 2
Graphic illustration of short-term forecasts provided by an epidemic model. Our short-term forecasts of the epidemic comprise a few generation intervals (prediction interval) immediately following a model-training period to estimate parameters (calibration interval).
Figure 3
Figure 3
Empirical distributions (histograms) and 95% confidence intervals (red horizontal lines) for parameters r and p obtained by nonlinear least-square fitting the generalized-growth model (GGM) to an increasing amount of incident notification data (10–45 epidemic days). Estimates of the deceleration of growth parameter (and their uncertainty) rapidly declined as the GGM was fitted to increasing amounts of data (ρ = − 0.85, P < 0.001).
Figure 4
Figure 4
Ten-day ahead forecasts provided by the generalized-growth model (GGM) when the model is fitted to an increasing amount of epidemic data: a 10, b 15, c 20, d 25, e 30, f 35, g 40, and h 45 epidemic days. The cyan curves correspond to the uncertainty during the model calibration period, while the gray curves correspond to the ensemble of realizations for the model forecast. The mean (solid red line) and 95% CIs (dashed red lines) of the model fit ensembles (gray curves) are also shown. The vertical line separates the calibration and forecasting periods (Color figure online).
Figure 5
Figure 5
Root-mean-squared errors (RMSE) during the calibration and forecasting intervals using the generalized-growth model (GGM) when the model is fitted to an increasing amount of epidemic data: 10, 15, 20, 25, 30, 35, 40, and 45 epidemic days. The mean (solid red line) and 95% CIs (dashed red lines) of the RMSE derived from the ensemble curves are shown (see Fig. 4 for the corresponding short-term forecasts) (Color figure online).
Figure 6
Figure 6
Ten-day ahead forecasts provided by the exponential growth model (EXPM) when the model is fitted to an increasing amount of epidemic data: a 10, b 15, c 20, d 25, e 30, f 35, g (40), and h 45 epidemic days. The cyan curves correspond to the uncertainty during the model calibration period, while the gray curves correspond to the ensemble of realizations for the model forecast. The mean (solid red line) and 95% CIs (dashed red lines) of the model fit ensembles (gray curves) are also shown. The vertical line separates the calibration and forecasting periods (Color figure online).
Figure 7
Figure 7
Ten-day ahead forecasts provided by the generalized-Richards model (GRM) when the model is fitted to an increasing amount of epidemic data: a 40, b 45, c 50, d 55, e 60, and f 65 days. The cyan curves correspond to the uncertainty during the model calibration period, while the gray curves correspond to the ensemble of realizations for the model forecast. The mean (solid red line) and 95% CIs (dashed red lines) of the model fit ensembles (gray curves) are also shown. The vertical line separates the calibration and forecasting periods (Color figure online).
Figure 8
Figure 8
Root-mean-squared errors (RMSE) during the calibration and forecasting intervals using the generalized-Richards model (GRM) when the model is fitted to an increasing amount of epidemic data: 40, 45, 50, 55, 60, 65 days. The mean (solid red line) and 95% CIs (dashed red lines) of the RMSE derived from the ensemble curves are shown (see Fig. 7 for the corresponding short-term forecasts) (Color figure online).

References

    1. Alexandersen S, Zhang Z, Donaldson AI, Garland AJM. The pathogenesis and diagnosis of foot-and-mouth disease. Journal of Comparative Pathology. 2003;129:1–36. doi: 10.1016/S0021-9975(03)00041-0. - DOI - PubMed
    1. Anderson I. Foot and Mouth Disease 2001: Lessons to be Learned Enquiry. London, UK: The Stationary Office; 2002.
    1. Arim M, Abades SR, Neill PE, Lima M, Marquet PA. Spread dynamics of invasive species. Proceedings of the National Academy of Sciences USA. 2006;103:374–378. doi: 10.1073/pnas.0504272102. - DOI - PMC - PubMed
    1. Bessell PR, Shaw DJ, Savill NJ, Woolhouse MEJ. Statistical modeling of holding level susceptibility to infection during the 2001 foot and mouth disease epidemic in Great Britain. International Journal of Infectious Diseases. 2010;14:e210–e215. doi: 10.1016/j.ijid.2009.05.003. - DOI - PubMed
    1. Chis Ster I, Ferguson NM. Transmission parameters of the 2001 foot and mouth epidemic in Great Britain. PLoS ONE. 2007;2:e502. doi: 10.1371/journal.pone.0000502. - DOI - PMC - PubMed

Publication types

LinkOut - more resources