

PICU Length of Stay: Factors Associated With Bed Utilization and Development of a Benchmarking Model
- PMID: 29239978
- PMCID: PMC5834365
- DOI: 10.1097/PCC.0000000000001425
PICU Length of Stay: Factors Associated With Bed Utilization and Development of a Benchmarking Model
Abstract
Objectives: ICU length of stay is an important measure of resource use and economic performance. Our primary aims were to characterize the utilization of PICU beds and to develop a new model for PICU length of stay.
Design: Prospective cohort. The main outcomes were factors associated with PICU length of stay and the performance of a regression model for length of stay.
Setting: Eight PICUs.
Patients: Randomly selected patients (newborn to 18 yr) from eight PICUs were enrolled from December 4, 2011, to April 7, 2013. Data consisted of descriptive, diagnostic, physiologic, and therapeutic information.
Interventions: None.
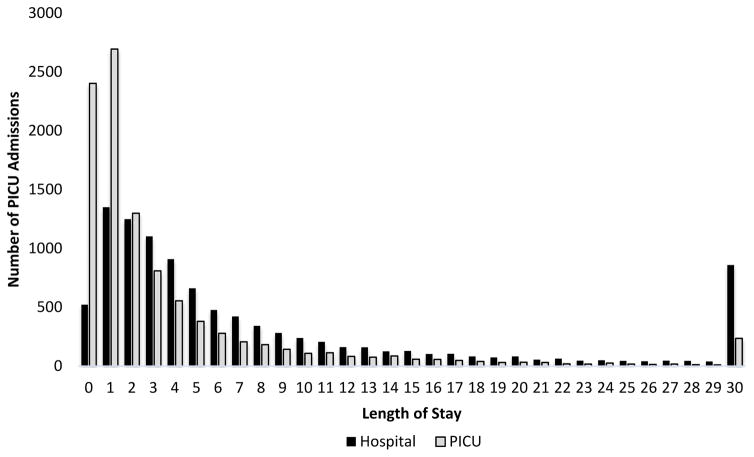
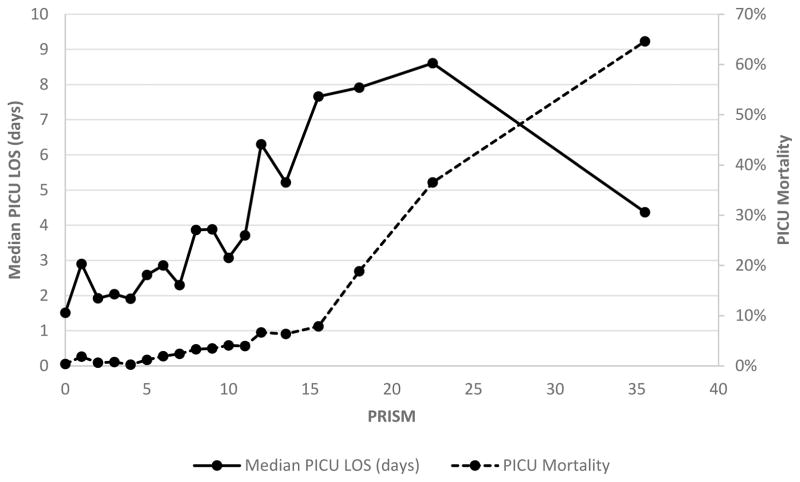
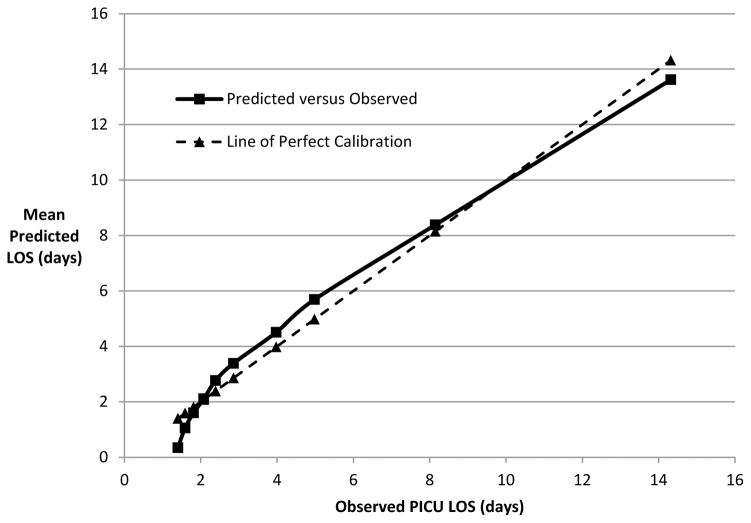
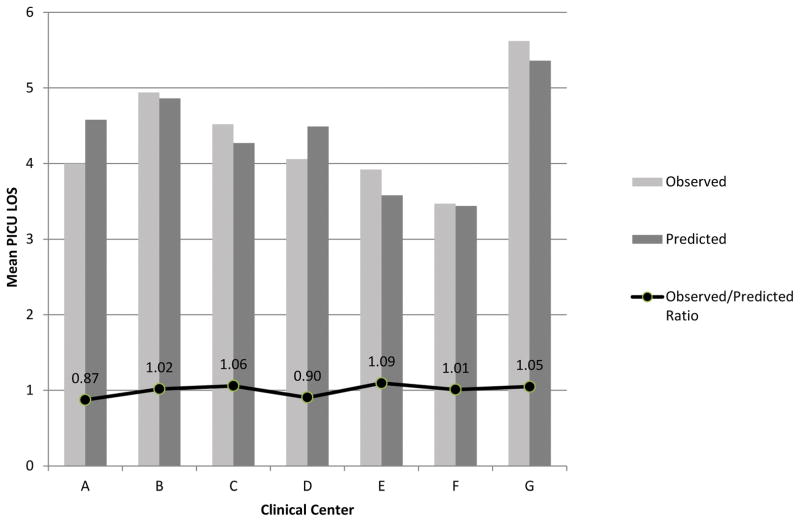
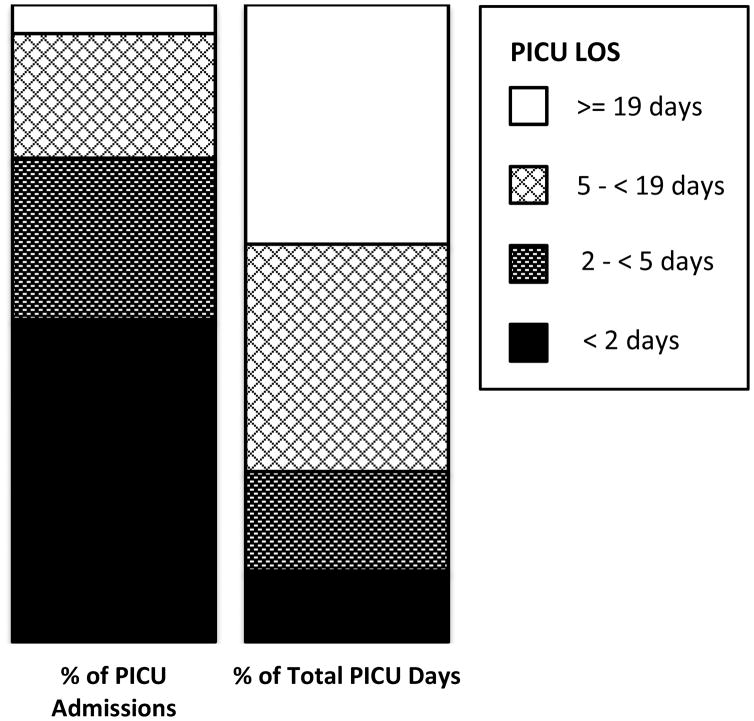
Measurements and main results: The mean length of stay for was 5.0 days (SD, 11.1), with a median of 2.0 days. The 50.6% of patients with length of stay less than 2 days consumed only 11.1% of the days of care, whereas the 19.6% of patients with length of stay 4.9-19 days and the 4.6% with length of stay greater than or equal to 19 days consumed 35.7% and 37.6% of the days of care, respectively. Longer length of stay was observed in younger children, those with cardiorespiratory disease, postintervention cardiac patients, and those who were sicker assessed by Pediatric Risk of Mortality scores receiving more intensive therapies. Patients in the cardiac ICU stayed longer than those in the medical ICU. The length of stay model using descriptive, diagnostic, severity, and therapeutic factors performed well (patient-level R-squared of 0.42 and institution-level R-squared of 0.76). Standardized (observed divided by expected) length of stay ratios at the individual sites ranged from 0.87 to 1.09.
Conclusions: PICU bed utilization was dominated by a minority of patients. The 5% of patients staying the longest used almost 40% of the bed days. The multivariate length of stay model used descriptive, diagnostic, therapeutic, and severity factors and has potential applicability for internal and external benchmarking.
Conflict of interest statement
Figures
References
-
- Breslow MJ, Badawi O. Severity scoring in the critically ill: part 2: maximizing value from outcome prediction scoring systems. Chest. 2012 Feb;141(2):518–527. - PubMed
-
- Gemke RJ, Bonsel GJ. Comparative assessment of pediatric intensive care: a national multicenter study. Pediatric Intensive Care Assessment of Outcome (PICASSO) Study Group. Crit Care Med. 1995 Feb;23(2):238–245. - PubMed
-
- Barrett MLSM, Elixhauser A, Honigman LS, Pines JM. Utilization of Intensive Care Services, 2011. Statistical Brief #185. Agency for Healthcare Research and Quality; 2014. - PubMed
-
- Ahmed S, Manaf NH, Islam R. Effects of Lean Six Sigma application in healthcare services: a literature review. Reviews on environmental health. 2013;28(4):189–194. - PubMed
-
- Zander K. A 30-Year Retrospective: Degrees of Difficulty in Decreasing LOS. Professional case management. 2016 Sep-Oct;21(5):233–242. - PubMed
Publication types
MeSH terms
Grants and funding
- U10 HD063108/HD/NICHD NIH HHS/United States
- U10 HD050012/HD/NICHD NIH HHS/United States
- UG1 HD049983/HD/NICHD NIH HHS/United States
- UG1 HD050096/HD/NICHD NIH HHS/United States
- U10 HD049981/HD/NICHD NIH HHS/United States
- U10 HD050096/HD/NICHD NIH HHS/United States
- U10 HD049983/HD/NICHD NIH HHS/United States
- UG1 HD063108/HD/NICHD NIH HHS/United States
- RL1 HD107773/HD/NICHD NIH HHS/United States
- U10 HD063114/HD/NICHD NIH HHS/United States
- U01 HD049934/HD/NICHD NIH HHS/United States
- UG1 HD049981/HD/NICHD NIH HHS/United States
- U10 HD063106/HD/NICHD NIH HHS/United States
- P30 CA022453/CA/NCI NIH HHS/United States
LinkOut - more resources
Full Text Sources
Other Literature Sources
Miscellaneous
