

Hospital-Acquired Pressure Injury: Risk-Adjusted Comparisons in an Integrated Healthcare Delivery System
- PMID: 29240656
- PMCID: PMC6013055
- DOI: 10.1097/NNR.0000000000000258
Hospital-Acquired Pressure Injury: Risk-Adjusted Comparisons in an Integrated Healthcare Delivery System
Abstract
Background: Although healthcare organizations have decreased hospital-acquired pressure injury (HAPI) rates, HAPIs are not eliminated, driving further examination in both nursing and health services research.
Objective: The objective was to describe HAPI incidence, risk factors, and risk-adjusted hospital variation within a California integrated healthcare system.
Methods: Inpatient episodes were included in this retrospective cohort if patients were hospitalized between January 1, 2013, and June 30, 2015. The primary outcome was development of a HAPI over time. Predictors included cited HAPI risk factors in addition to incorporation of a longitudinal comorbidity burden (Comorbidity Point Score, Version 2 [COPS2]), a severity-of-illness score (Laboratory-Based Acute Physiology Score, Version 2 [LAPS2]), and the Braden Scale for Predicting Pressure Ulcer Risk.
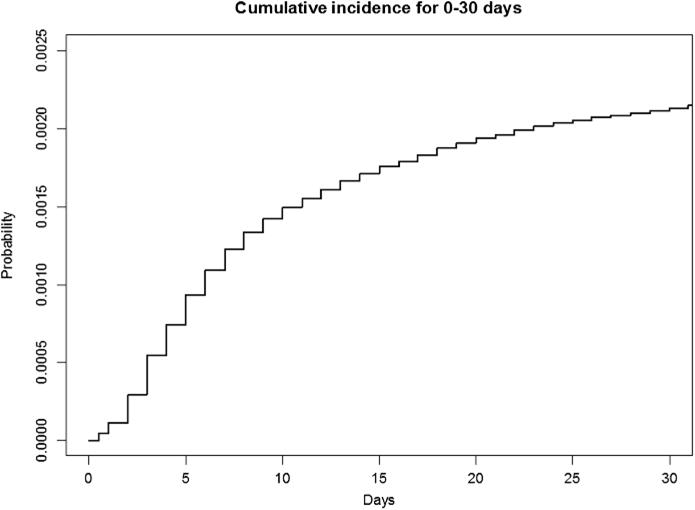
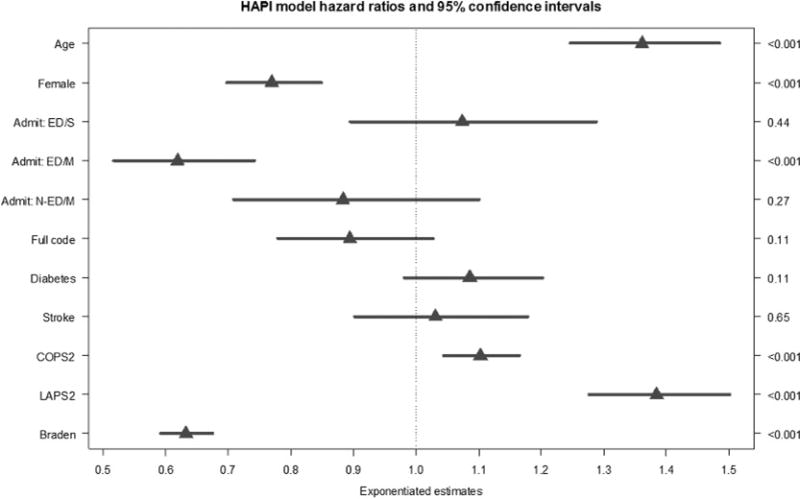
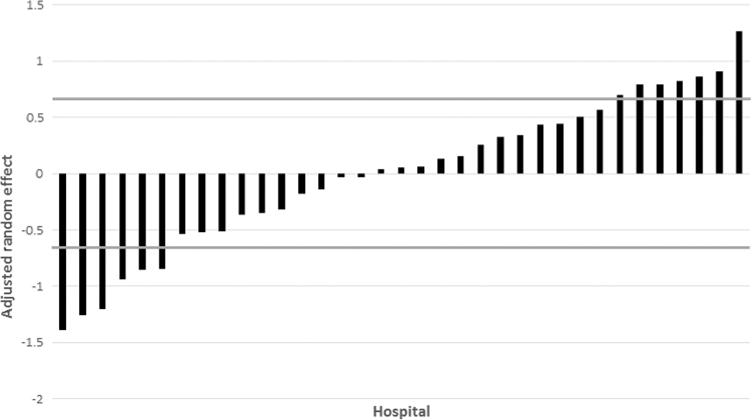
Results: Analyses included HAPI inpatient episodes (n = 1661) and non-HAPI episodes (n = 726,605). HAPI incidence was 0.57 per 1,000 patient days (95% CI [0.019, 3.805]) and 0.2% of episodes. A multivariate Cox proportional hazards model showed significant (p < .001) hazard ratios (HRs) for the change from the 25th to the 75th percentile for age (HR = 1.36, 95% CI [1.25, 1.45]), higher COPS2 scores (HR = 1.10, 95% CI [1.04, 1.16]), and higher LAPS2 scores (HR = 1.38, 95% CI [1.28, 1.50]). Female gender, an emergency room admission for a medical reason, and higher Braden scores showed significant protective HRs (HR < 1.00, p < .001). After risk adjustment, significant variation remained among the 35 hospitals.
Discussion: Results prompt the consideration of age, severity of illness (LAPS2), comorbidity indexes (COPS2), and the Braden score as important predictors for HAPI risk. HAPI rates may be low; however, because of significant individual site variation, HAPIs remain an area to explore through both research and quality improvement initiatives.
Conflict of interest statement
The authors have no conflicts of interest to disclose.
Figures
References
-
- Agency for Healthcare Research and Quality. 2015 National healthcare quality and disparities report and 5th anniversary update on the national quality strategy. Rockville, MD: Author; 2016. (AHRQ Publication No. 16-0015). Retrieved from https://www.ahrq.gov/sites/default/files/wysiwyg/research/findings/nhqrd....
-
- Bergquist-Beringer SD, Davidson J, Cuddigan J. Module IV: Community vs. hospital/unit acquired pressure ulcers. 2017 Retrieved from https://members.nursingquality.org/NDNQIPressureUlcerTraining/
Publication types
MeSH terms
Grants and funding
LinkOut - more resources
Full Text Sources
Other Literature Sources
Medical
