. 2017 Dec 14;15(12):e2004050.
doi: 10.1371/journal.pbio.2004050. eCollection 2017 Dec.

Single-cell RNA sequencing reveals intrinsic and extrinsic regulatory heterogeneity in yeast responding to stress

Affiliations

Single-cell RNA sequencing reveals intrinsic and extrinsic regulatory heterogeneity in yeast responding to stress

Audrey P Gasch et al. PLoS Biol. .

Abstract

From bacteria to humans, individual cells within isogenic populations can show significant variation in stress tolerance, but the nature of this heterogeneity is not clear. To investigate this, we used single-cell RNA sequencing to quantify transcript heterogeneity in single Saccharomyces cerevisiae cells treated with and without salt stress to explore population variation and identify cellular covariates that influence the stress-responsive transcriptome. Leveraging the extensive knowledge of yeast transcriptional regulation, we uncovered significant regulatory variation in individual yeast cells, both before and after stress. We also discovered that a subset of cells appears to decouple expression of ribosomal protein genes from the environmental stress response in a manner partly correlated with the cell cycle but unrelated to the yeast ultradian metabolic cycle. Live-cell imaging of cells expressing pairs of fluorescent regulators, including the transcription factor Msn2 with Dot6, Sfp1, or MAP kinase Hog1, revealed both coordinated and decoupled nucleocytoplasmic shuttling. Together with transcriptomic analysis, our results suggest that cells maintain a cellular filter against decoupled bursts of transcription factor activation but mount a stress response upon coordinated regulation, even in a subset of unstressed cells.


Conflict of interest statement

I have read the journal's policy and the authors of this manuscript have the following competing interests: SRQ is a co-founder of Fluidigm, whose technology was used as part of this project.

Figures

Fig 1
Fig 1. Quantitative variation in ESR activation across cells.
(A) Mean-centered log2(read counts) for ESR gene groups before and after stress. Each row represents a transcript and each column is an individual cell, with expression values according to the key; white indicates no detected transcript. (B) The average mean-centered log2 values for a given ESR gene group as measured in one cell was plotted against the average mean-centered log2 values for a second ESR gene group as measured in the same cell. Correlations for unstressed (orange) and stressed (purple) cells are indicated on each plot. (C) Boxplots (without whiskers) of mean-centered log2(read counts) of RP and iESR transcripts in individual cells, sorted by iESR-group median. Arrows indicate unstressed cells with unusually low RP transcript abundances (FDR < 0.05, see Quantitative variation in ESR expression) and asterisks indicate those cells that also had high median iESR log2 values. ESR, Environmental Stress Response; FDR, false discovery rate; iESR, induced-Environmental Stress Response; RiBi, ribosome biogenesis; RP, ribosomal protein.
Fig 2
Fig 2. RP transcripts show low variation in abundance across cells.
The mean and variance of transcript read counts per mRNA length (“length-norm”) was plotted for each mRNA from unstressed (left) or stressed (right) cells. (A,C) highlight RP transcripts and (B,D) highlight iESR and RiBi transcript against all other mRNAs (grey points). Plots are zoomed to capture most points. iESR, induced-Environmental Stress Response; RiBi, ribosome biogenesis; RP, ribosomal protein.
Fig 3
Fig 3. Transcript detection rate correlates with functional class.
The fraction of cells in which each mRNA was detected was plotted against the mean length-normalized read count for that transcript, calculated from cells in which the transcript was measured, in (A) unstressed or (B) stressed cells. Listed p-values and arrows (where significant) indicate if the detection rate was higher or lower than randomly sampled genes. Plots are zoomed in to show transcripts whose mean read count is below 1.0; most transcripts above this range are detected in all cells, not shown. iESR, induced-Environmental Stress Response; RiBi, ribosome biogenesis; RP, ribosomal protein.
Fig 4
Fig 4. Single-molecule FISH confirms differences in detection rate at several transcripts.
Distributions of (A) length-normalized read counts measured by scRNA-seq and (B) mRNA molecules per cell measured by single-molecule FISH, for PPT1, RLP7, and SES1 as a control. Note only part of the SES1 distribution is shown. Median counts in cells with a measurement and detection rate (percentage of cells with a measurement) are listed below the figure. Data are available in S10 Table. scRNA-seq, single-cell RNA sequencing.
Fig 5
Fig 5. The influence of cell-cycle phase on ESR activation.
Cycling genes used for classification were identified by clustering the scRNA-seq data [54] and then selecting clusters enriched for cell-cycle markers (S3 Table, see Methods). (A) Cells (columns) were clustered based on the centroid expression pattern of genes within each group (rows) and manually classified into and sorted within designated groups (A, grey bins, S9 Table). Stressed and unstressed cells are annotated by the purple/orange vector (A, bottom row). (B) The percentage of cells in each cell-cycle phase. Cell phases are listed in S5 Table. (C) Boxplots (without whiskers) of all iESR (red) or RP (blue) genes from cells in that phase. Significance was assessed by Welch t test on the pooled RP or iESR genes from cells within a given phase compared to all other cells; unstressed and stressed cells were analyzed separately. Note only one cell was classified as G1/S after stress. ESR, Environmental Stress Response; iESR, induced-Environmental Stress Response; RP, ribosomal protein; scRNA-seq, single-cell RNA sequencing.
Fig 6
Fig 6. Regulatory variation across single cells.
Distribution (without whiskers) of mean-centered log2(read count) values for indicated TF targets in single cells, organized as in Fig 1C. The number of targets for each TF is shown in parentheses. Grey-scale heat map (horizontal boxes) represents the detection rate, according to the key. (A-D) Targets of TFs that were differentially expressed in a large fraction of cells (see S6 Table). (E-F) Cells for which targets of Rpn4 (E) or Hsf1 (F) were significantly elevated (FDR < 0.053) compared to all other stressed cells are colored. TF, transcription factor.
Fig 7
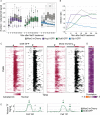
Fig 7. Stress-activated regulators show both coordinated and decoupled nuclear localization.
(A) Distribution of nuclear/cytoplasmic signal for paired factors in individual cells before and after NaCl treatment (average n = 676 cells per time point). Data from two biological replicates were very similar and combined (S11 Table). (B) Median ratios from (A) plotted over time; the Msn2 plot combines measurements from all three strains. (C) Nuclear TF signals (see Methods) of Dot6-GFP (left) and Msn2-mCherry (right) expressed in the same cells over time, before stress and after NaCl addition at 81 min (arrows). Each row aligned across all plots represents a different cell, and each column represents a different time point. Red plots show traces of nuclear localization according to the key (see Methods), and corresponding grey-scale plots show quantitative measurements only for time points called as peaks. Colored boxes above the plots indicate 80 min before stress (grey box), 30 min after NaCl treatment (dark red box), and beyond 30 min after NaCl treatment (pink box). Data are available in S12 Table. (D) Correlation between Dot6-GFP and Msn2-mCherry traces for each temporal phase, according to the key. (E) Representative traces from (C), where called peaks (colored according to key) are indicated with asterisks. TF, transcription factor.

References

    1. Balaban NQ, Merrin J, Chait R, Kowalik L, Leibler S. Bacterial persistence as a phenotypic switch. Science (New York, NY. 2004;305(5690):1622–5. - PubMed
    1. Sharma SV, Lee DY, Li B, Quinlan MP, Takahashi F, Maheswaran S, et al. A chromatin-mediated reversible drug-tolerant state in cancer cell subpopulations. Cell. 2010;141(1):69–80. doi: 10.1016/j.cell.2010.02.027 - DOI - PMC - PubMed
    1. Roesch A, Fukunaga-Kalabis M, Schmidt EC, Zabierowski SE, Brafford PA, Vultur A, et al. A temporarily distinct subpopulation of slow-cycling melanoma cells is required for continuous tumor growth. Cell. 2010;141(4):583–94. doi: 10.1016/j.cell.2010.04.020 - DOI - PMC - PubMed
    1. Shaffer SM, Dunagin MC, Torborg SR, Torre EA, Emert B, Krepler C, et al. Rare cell variability and drug-induced reprogramming as a mode of cancer drug resistance. Nature. 2017;546(7658):431–5. doi: 10.1038/nature22794 - DOI - PMC - PubMed
    1. Andrusiak K. Adapting S. cerevisiae Chemical Genomics for Identifying the Modes of Action of Natural Compounds Toronto: University of Toronto; 2012.

Publication types

MeSH terms