Comparative Study
. 2017 Dec 14;12(12):e0189577.
doi: 10.1371/journal.pone.0189577. eCollection 2017.

Scientific research on animal biodiversity is systematically biased towards vertebrates and temperate regions

Affiliations
Comparative Study

Scientific research on animal biodiversity is systematically biased towards vertebrates and temperate regions

Mark A Titley et al. PLoS One. .

Abstract

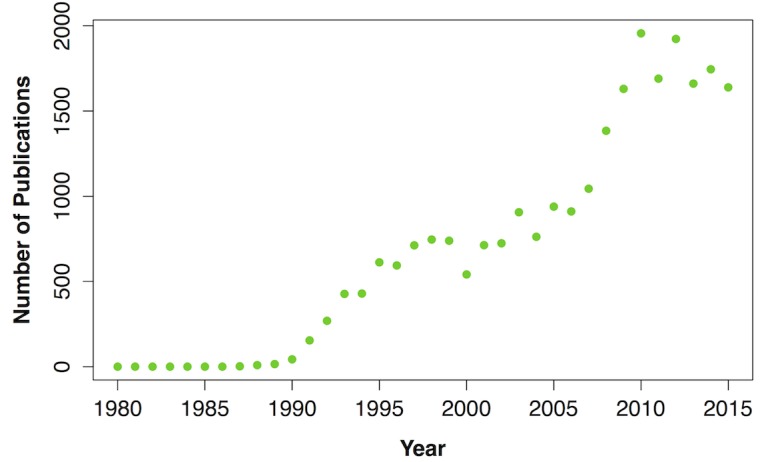
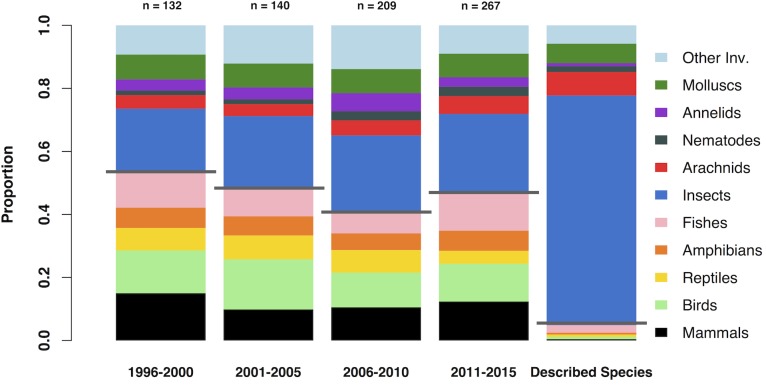
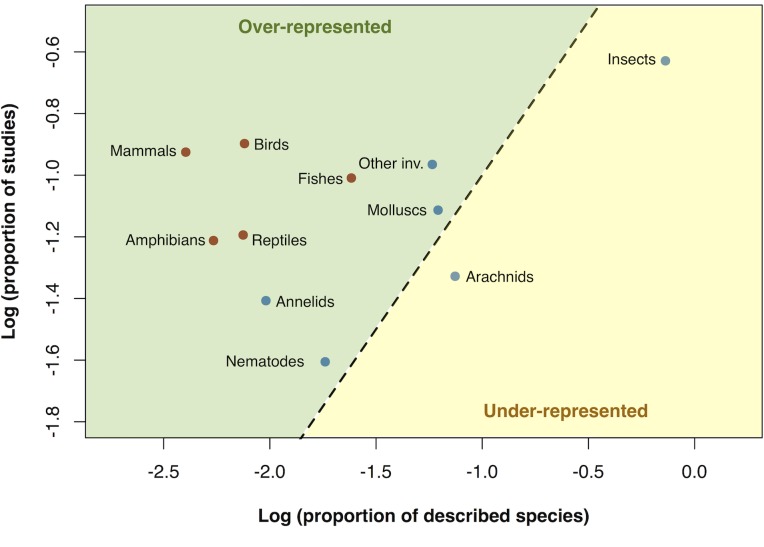
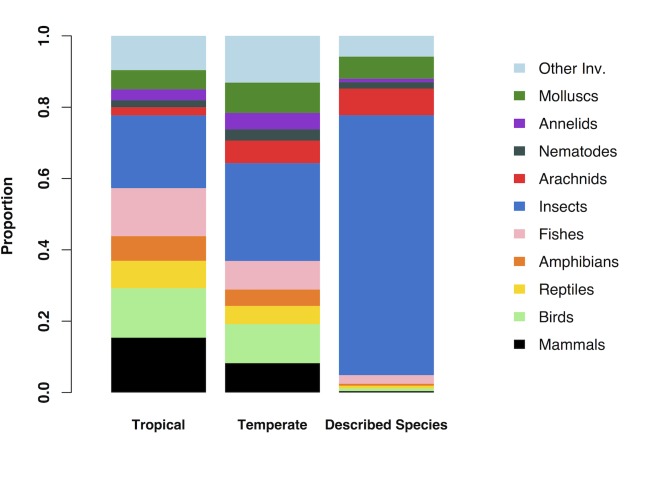
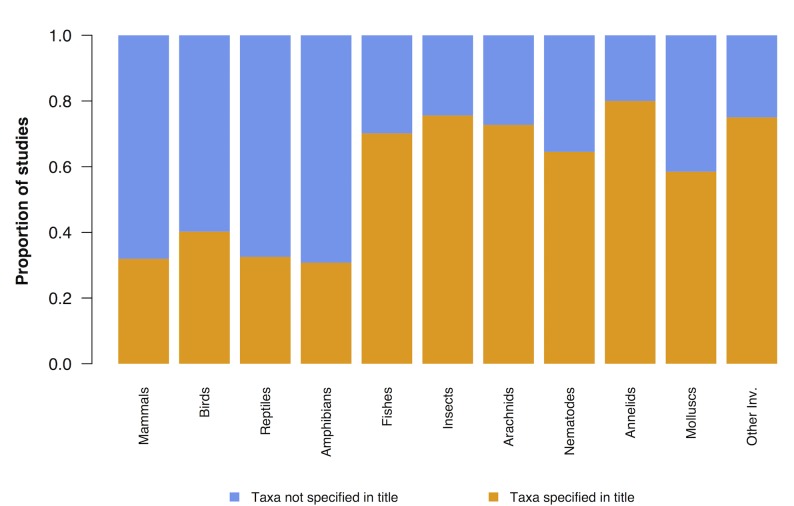
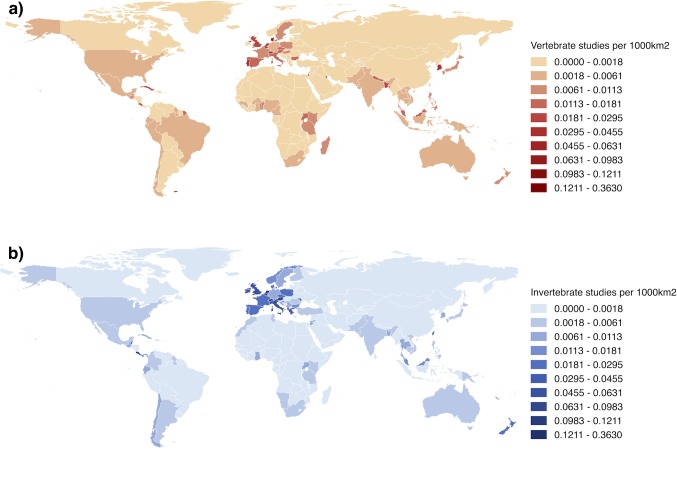
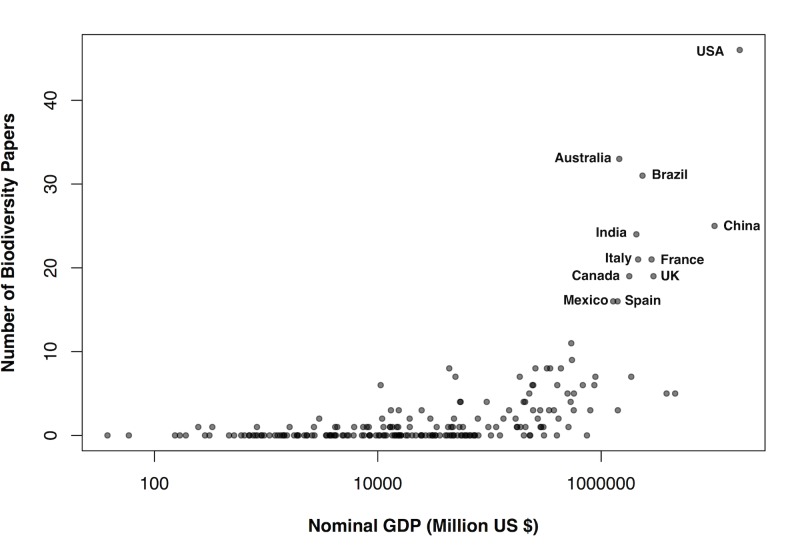
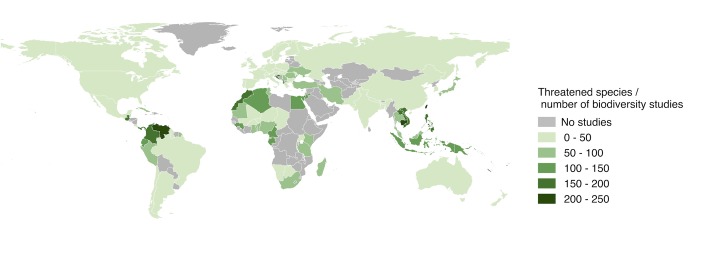
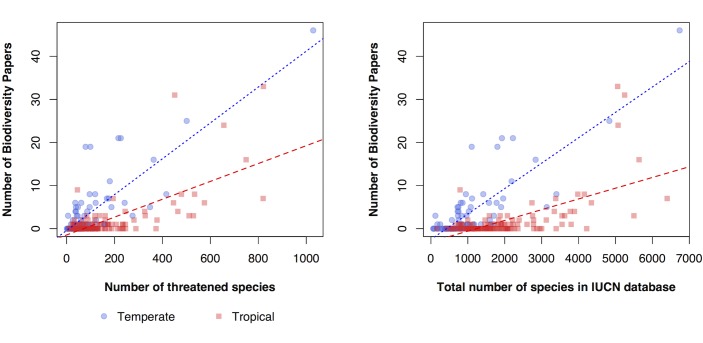
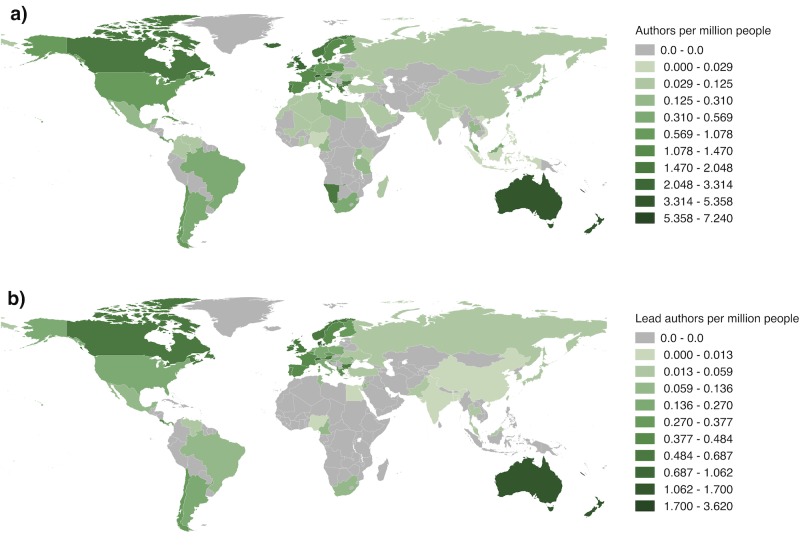
Over the last 25 years, research on biodiversity has expanded dramatically, fuelled by increasing threats to the natural world. However, the number of published studies is heavily weighted towards certain taxa, perhaps influencing conservation awareness of and funding for less-popular groups. Few studies have systematically quantified these biases, although information on this topic is important for informing future research and conservation priorities. We investigated: i) which animal taxa are being studied; ii) if any taxonomic biases are the same in temperate and tropical regions; iii) whether the taxon studied is named in the title of papers on biodiversity, perhaps reflecting a perception of what biodiversity is; iv) the geographical distribution of biodiversity research, compared with the distribution of biodiversity and threatened species; and v) the geographical distribution of authors' countries of origin. To do this, we used the search engine Web of Science to systematically sample a subset of the published literature with 'biodiversity' in the title. In total 526 research papers were screened-5% of all papers in Web of Science with biodiversity in the title. For each paper, details on taxonomic group, title phrasing, number of citations, study location, and author locations were recorded. Compared to the proportions of described species, we identified a considerable taxonomic weighting towards vertebrates and an under-representation of invertebrates (particularly arachnids and insects) in the published literature. This discrepancy is more pronounced in highly cited papers, and in tropical regions, with only 43% of biodiversity research in the tropics including invertebrates. Furthermore, while papers on vertebrate taxa typically did not specify the taxonomic group in the title, the converse was true for invertebrate papers. Biodiversity research is also biased geographically: studies are more frequently carried out in developed countries with larger economies, and for a given level of species or threatened species, tropical countries were understudied relative to temperate countries. Finally, biodiversity research is disproportionately authored by researchers from wealthier countries, with studies less likely to be carried out by scientists in lower-GDP nations. Our results highlight the need for a more systematic and directed evaluation of biodiversity studies, perhaps informing more targeted research towards those areas and taxa most depauperate in research. Only by doing so can we ensure that biodiversity research yields results that are relevant and applicable to all regions and that the information necessary for the conservation of threatened species is available to conservation practitioners.


Conflict of interest statement

Competing Interests: The authors have declared that no competing interests exist.

Figures

Fig 1
Fig 1. The number of papers whose title contains the word biodiversity over time from 1980–2015.
A search for the word ‘biodiversity’ in Web of Science by year reveals the increase in biodiversity research over time (search date: 10th February 2016).
Fig 2
Fig 2. The proportions of different animal taxa studied in biodiversity research over the last 20 years.
The proportion of different taxonomic groups in the sample of papers with ‘biodiversity’ in the title is shown for 4 five-year periods since 1996. For comparison, the right-hand column illustrates the ‘true’ proportions of described species that each group makes up (data from IUCN [20]) Vertebrate and invertebrate taxa are separated by a grey line.
Fig 3
Fig 3. The over- and under-representation of different animal groups in biodiversity research relative to the number of described species.
The proportion of studies on each taxonomic group is plotted against the ‘actual’ proportion of described species [20] found in that taxon. Values were log transformed for clarity. The 1:1 line is shown (dotted); over-represented groups are found above the line while under-represented groups are below it. Vertebrate groups are shown in red and invertebrate groups are shown in blue.
Fig 4
Fig 4. Representation of different animal groups in temperate and tropical biodiversity studies.
The bias towards vertebrates is greater in tropical regions than temperate regions. The proportions of described species in different groups are shown in the right-hand column for comparison.
Fig 5
Fig 5. The phrasing of papers’ titles differs between taxonomic groups.
The majority of studies on vertebrates (with the exception of studies on fishes) do not mention the study taxon in the title. Conversely, for papers on invertebrates, the taxa being studied were specified more often than not.
Fig 6
Fig 6. The global distribution of biodiversity research by country.
The number of papers with ‘biodiversity’ in the title per 1000km2 is shown, for a) papers that study vertebrates and b) papers that study invertebrates. Darker colours represent a higher density of studies.
Fig 7
Fig 7. The number of biodiversity papers in a country related to its GDP.
Nominal GDP in US$ is plotted against the number of biodiversity studies sampled from each country, revealing a positive relationship. The top ten countries for number of papers are labelled. Many countries with low GDP had no biodiversity papers identified from this sample.
Fig 8
Fig 8. The number of Red-Listed animal species in each country relative to the number of biodiversity studies.
Dividing the number of animal species threatened with extinction [19] by the number of biodiversity studies reveals regions that are understudied given their number of threatened species. Countries in northern South America, Africa and SE Asia stand out as being relatively understudied; much of central Africa lacked studies altogether in this sample. Darker colours represent a higher number of listed threatened species per study.
Fig 9
Fig 9
Scatterplots comparing the number of biodiversity papers against the number of threatened animal species (a) and species richness (b) listed in IUCN databases [19, 20] per country. Temperate countries tend to have more biodiversity research than tropical countries for a given number of threatened species or a given species richness.
Fig 10
Fig 10. Number of authors and lead authors per million people for each country.
The number of authors (a) and lead authors (b) from each country relative to the country’s population. Many countries in Africa, central Asia and South America lacked authors on the papers in the sample.

References

    1. Wilson EO. Biodiversity. National Academies Press; 1988. - PubMed
    1. Google [Internet]. 2016 [cited 16 Aug 2016]. Available: https://www.google.co.uk/#q=biodiversity
    1. Web of Science [Internet]. 2016 [cited 6 Feb 2016]. Available: https://apps.webofknowledge.com
    1. United Nations. Convention on Biological Diversity [Internet]. 1992. doi: 10.1146/annurev.ento.48.091801.112645 - DOI - PubMed
    1. Gaston KJ. Biodiversity. In: Sodhi N, Ehrlich PR, editors. Conservation Biology for All. Oxford University Press; 2010. doi: 10.1093/acprof:oso/9780199554232.001.0001 - DOI

Publication types

LinkOut - more resources