. 2017 Dec 12;21(11):3065-3078.
doi: 10.1016/j.celrep.2017.11.049.

Infrabarrels Are Layer 6 Circuit Modules in the Barrel Cortex that Link Long-Range Inputs and Outputs

Affiliations

Infrabarrels Are Layer 6 Circuit Modules in the Barrel Cortex that Link Long-Range Inputs and Outputs

Shane R Crandall et al. Cell Rep. .

Abstract

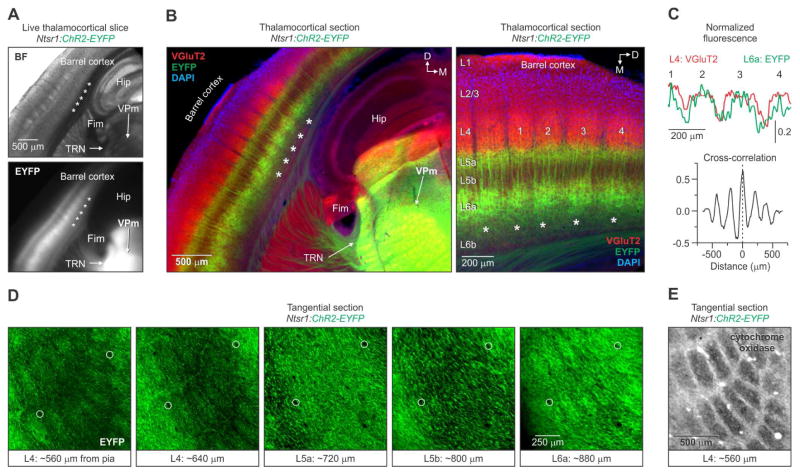
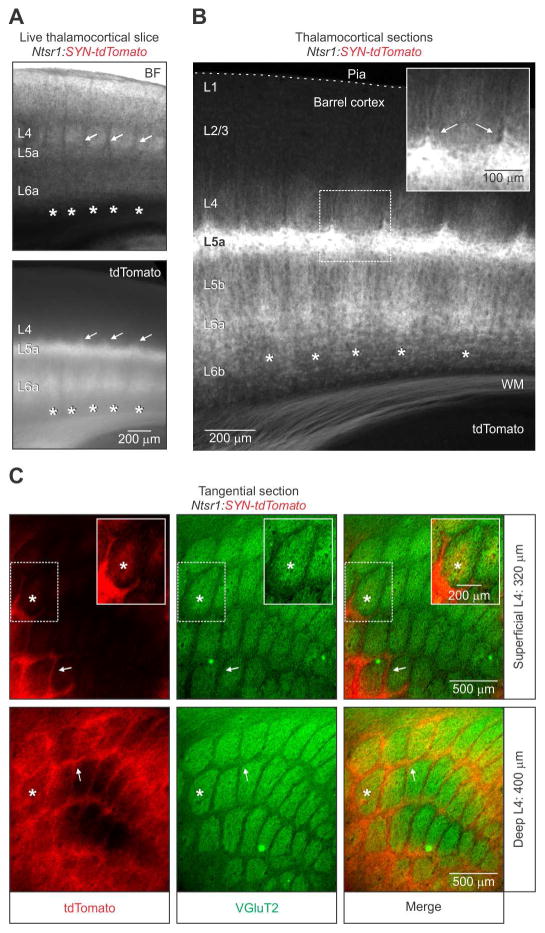
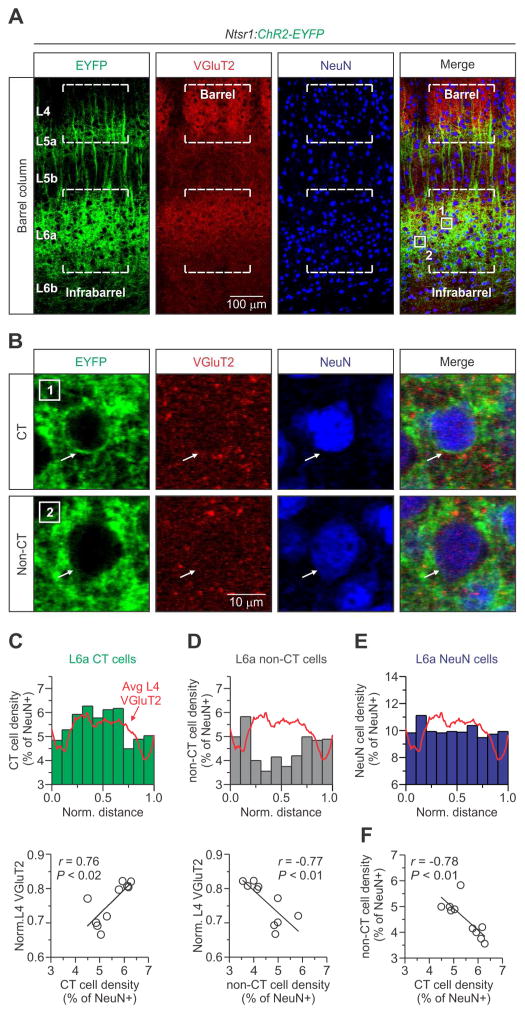
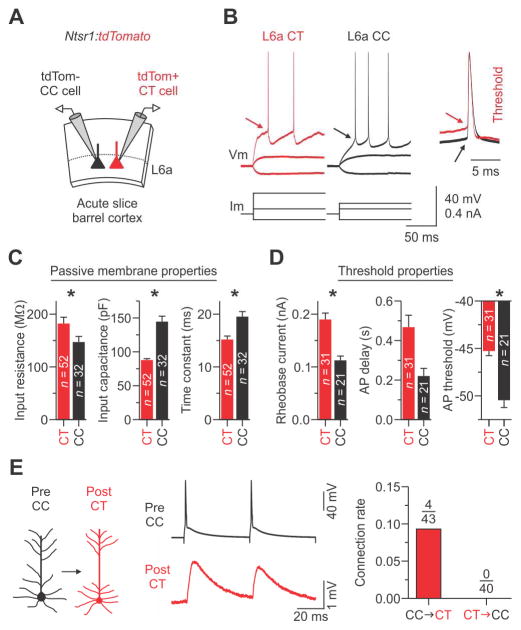
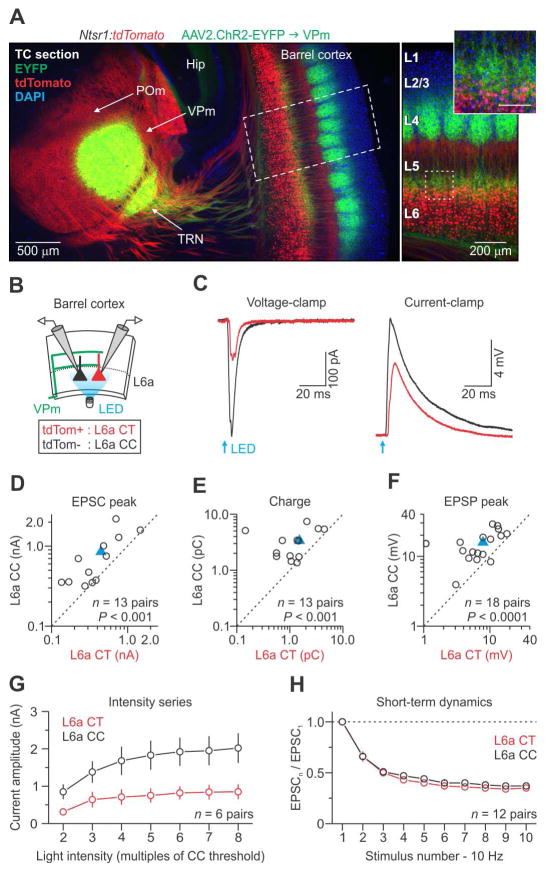
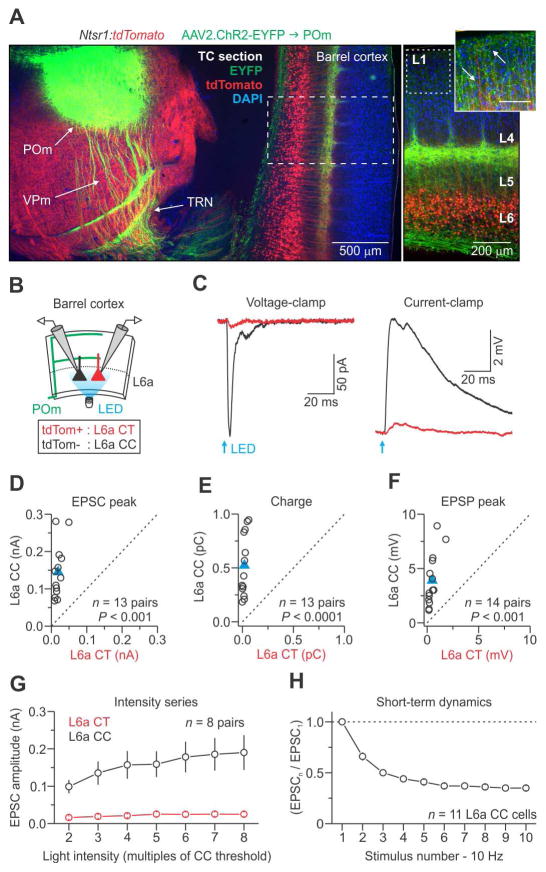
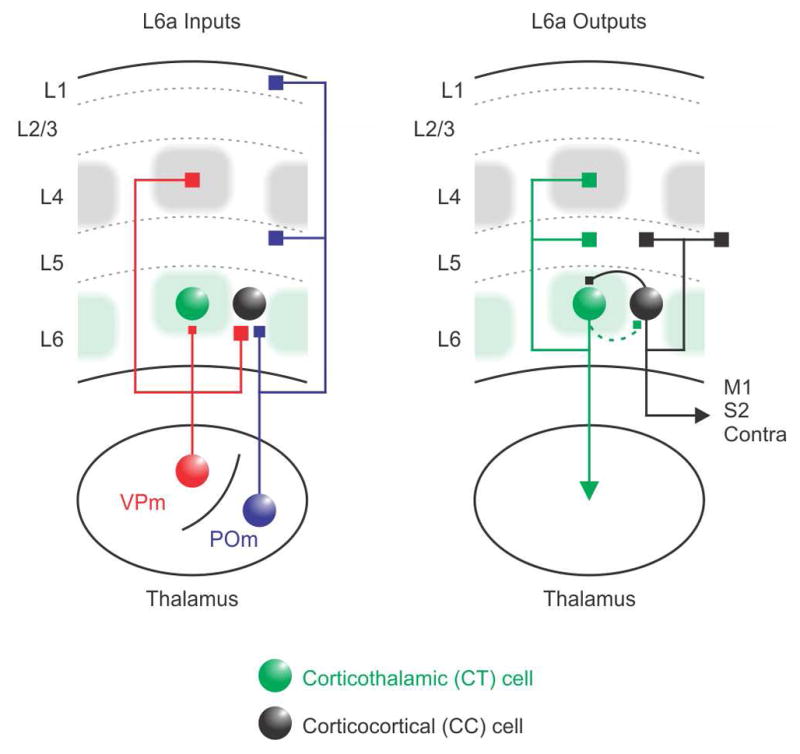
The rodent somatosensory cortex includes well-defined examples of cortical columns-the barrel columns-that extend throughout the cortical depth and are defined by discrete clusters of neurons in layer 4 (L4) called barrels. Using the cell-type-specific Ntsr1-Cre mouse line, we found that L6 contains infrabarrels, readily identifiable units that align with the L4 barrels. Corticothalamic (CT) neurons and their local axons cluster within the infrabarrels, whereas corticocortical (CC) neurons are densest between infrabarrels. Optogenetic experiments showed that CC cells received robust input from somatosensory thalamic nuclei, whereas CT cells received much weaker thalamic inputs. We also found that CT neurons are intrinsically less excitable, revealing that both synaptic and intrinsic mechanisms contribute to the low firing rates of CT neurons often reported in vivo. In summary, infrabarrels are discrete cortical circuit modules containing two partially separated excitatory networks that link long-distance thalamic inputs with specific outputs.

Keywords: channelrhodopsin; corticofugal; infragranular; layer 6; neocortex; septa; synapse; thalamocortical; thalamus; whisker.


Figures

Figure 1
Figure 1. Infrabarrels in L6a of primary somatosensory cortex
(A) (Top) Bright-field (BF) image of a live 300 μm thick thalamocortical slice through barrel cortex of a 25-day old Ntsr1:ChR2-EYFP mouse. (Bottom) Epifluorescence image of the same slice showing a periodic pattern of EYFP in infragranular layers (asterisks) (similar patterns were observed in n > 27 mice). (B) (Left) Image of an 80 μm thick section, obtained from the slice shown in (A), stained immunohistochemically for VGluT2 and DAPI. (Right) Higher magnification image showing the relationship between VGluT2 and EYFP fluorescence. (C) Cross-correlation of the fluorescence intensity profiles (L4: VGluT2; L6a: EYFP) as a function of horizontal distance for the 4 barrels labeled in (B). EYFP fluorescence in L6a was strongly correlated with the L4 VGluT2 fluorescence (Mean peak correlation = 0.50 ± 0.04; n = 7 slices, 7 hemispheres, 6 mice). (D) Confocal images of adjacent 80 μm thick tangential sections through barrel cortex of a 26-day old Ntsr1:ChR2-EYFP mouse. Notice the row-like pattern of ellipsoid-shaped EYFP units in L4 and L6a. Sections were aligned by blood vessels (circles) (similar patterns were observed in 4 hemispheres from 2 mice). (E) A cytochrome oxidase-stained tangential section through L4 of barrel cortex. Tissue was obtained from the opposite hemisphere of the mouse shown in (D) (n = 2 hemispheres from 2 mice). Hip, hippocampus; Fim, fimbria; TRN, thalamic reticular nucleus VPm, ventral posterior medial nucleus. See also Figure S1.
Figure 2
Figure 2. Organization of L6 CT axon collaterals in barrel cortex
(A) (Top) Bright-field (BF) image and epifluorescence image (Bottom) showing the expression pattern of tdTomato in a live 300 μm thick thalamocortical slice through the barrel cortex of a 34-day old Ntsr1:synaptophysin(SYN)-tdTomato mouse. In addition to the periodic pattern of tdTomato in L6a (asterisks), there was a robust expression in both L5a and L4 septa (arrows). (B) Image of an 80 μm thick brain section, taken from the live slice shown in (A). The inset shows tdTomato in L4 septa (arrows). Similar patterns were observed in 4 hemispheres from 2 mice). (C) Fluorescent images of adjacent 80 μm thick tangential sections through L4 barrel cortex of a 56-day old Ntsr1:SYN-tdTomato mouse. The expression of tdTomato in L4 was particularly robust in the septa (arrows) between barrels stained immunohistochemically for VGluT2. The inset image shows the presence of tdTomato in the barrel center after additional contrast enhancement. The asterisk denotes the approximate location of an individual barrel in adjacent sections. A similar pattern of tdTomato was seen in repeated experiments (n = 4 hemispheres from 2 mice).
Figure 3
Figure 3. The cytoarchitecture of L6a infrabarrels
(A) Confocal images of an aligned L4 barrel and L6a infrabarrel (dashed lines) taken from a 25-day old Ntsr1:ChR2-EYFP mouse. The example shown is the #3 “barrel column” in Figure 1B. Tissue was stained immunohistochemically for VGluT2 and NeuN. (B) High magnification image of the boxed areas in (A, far right) showing two types of NeuN positive cells. CT and non-CT neurons were identified by the Cre-dependent expression of ChR2-EYFP in their membranes (arrow). (C) (Top) A normalized distribution plot of L6a CT cells (n = 1110 CT cells, 8 barrel columns, 4 hemispheres, 3 mice). The red trace represents the average fluorescence intensity of L4 VGluT2 for all columns examined. (Bottom) Plot showing a strong and significant positive correlation between the density of CT neurons per bin and L4 VGluT2 (r = 0.76, p = 0.010, Pearson’s correlation coefficient). (D) (Top) Normalized distribution of L6a non-CT cells (n = 915 non-CT cells, 8 barrel columns, 4 hemispheres, 3 mice). (Bottom) Plot showing a strong and significant negative correlation between the density of non-CT neurons per bin and L4 VGluT2 (r = −0.76, p = 0.009, Pearson’s correlation coefficient). (E) A normalized distribution plot of all L6a NeuN cells. There was no correlation between the density of all L6a neurons and L4 VGluT2 (Data not shown; r = 0.79, p = −0.093, Pearson’s correlation coefficient). (F) Plot showing a strong and significant negative correlation between the density of L6a non-CT and CT neurons per bin (r = 0.76, p = 0.010, Pearson’s correlation coefficient). See also Figure S2.
Figure 4
Figure 4. Intrinsic physiological properties of CT and CC cells in L6a
(A) Schematic of the slice recording configuration. L6a CT cells were identified by Cre-dependent tdTomato expression while CC cells were identified as tdTomato-negative and physiologically as regular-spiking (see Figure S3–S5). (B) Voltage responses to injected current of representative CT and CC cells. Evoked action potentials (APs) required more current to reach threshold (arrow, inset) in CT cells than in CC cells. (C and D) Histograms showing the mean ± s.e.m. for key passive properties (C) and AP threshold properties (D). Asterisks indicate statistical significance. See Table S1 for summary statistics for all intrinsic properties. (E) (Left and middle) Unitary EPSPs in a CT cell evoked by APs in a CC (trace represents the average of 15 trials, train of two APs at 20 Hz; holding potentials for both cells were −84 mV). (Right) Summary graph of the connection rate between CT and CC neurons. In total, we found 0 CT-to-CC connections (0.0%; n = 40 pairs tested in 23 mice) and 4 CC-to-CT connections (9.3%; n = 43 pairs tested in 24 mice) with mean unitary EPSP amplitudes of 0.7 ± 0.2 mV on the first AP (see Figure S8). Summary statistics (Input resistance: CT cells = 182.2 ± 12.0 MΩ; CC cells = 147.1 ± 10.7 MΩ; n = 52/32 CT/CC cells from 24/20 mice, p = 0.0348, two-tailed Mann-Whitney U-test; Input capacitance: CT cells = 87.9 ± 2.1 pF; CC cells = 144.6 ± 8.0 pF; n = 52/32 cells from 24/20 mice, p = 6.44 × 10⁻¹¹, two-tailed Mann-Whitney U-test; Time constant: CT cells = 15.2 ± 0.7 ms; CC cells = 19.5 ± 1.0 ms; n = 52/32 cells from 24/20 mice, p = 5.22 × 10⁻⁵, two-tailed Mann-Whitney U-test; Rheobase current: CT cells = 190.0 ± 12.2 pA; CC cells = 112.4 ± 8.2 pA; n = 31/21 cells from 16/12 mice, p = 1.64 × 10⁻⁵, two-tailed t-test; AP delay: CT cells = 468.0 ± 60.0 ms; CC cells = 220.6 ± 38.7 ms; n = 31/21 cells from 16/12 mice, p = 0.05187, two-tailed Mann-Whitney U-test; AP threshold: CT cells = −45.3 ± 0.5 mV; CC cells = −50.5 ± 0.8 mV; n = 31/21 cells from 16/12 mice, p = 2.18 × 10⁻⁷, two-tailed t-test). Data are represented as mean ± SEM. See also Figure S3–S5 and S8; Table S1 and S2.
Figure 5
Figure 5. VPm-evoked synaptic responses in pyramidal neurons of L6a
(A) (Left) Low-magnification fluorescence image taken of a fixed thalamocortical (TC) section (40 μm thick) showing EYFP expression 13 days after injecting a virus (AAV2) carrying genes for ChR2-EYFP into the VPm of a Ntsr1:tdTomato mouse. The section was counter-stained with DAPI. (Right) High-magnification image showing EYFP-labeled VPm axons terminating densely in L4 barrels and at the L5/6 border (inset; scale 100 μm). (B) Schematic of the recording configuration showing photostimulation of ChR2-expressing VPm axons (green) and recordings from CT-CC cell pairs. (C) EPSCs and EPSPs for a CT and CC cell pair in response to activation of VPm axons (voltage-clamp at −94 mV and current-clamp at −84 mV; 1 ms light pulse duration; traces represent the average of 15 voltage-clamp and 7 current-clamp trials). Light intensities were ~3x threshold for evoking an EPSP in CC cells (mean intensity = 0.90 ± 0.17 mW; n = 18 pairs from 9 mice). (D–F) Summary data plots. Blue triangles represent means. (G) VPm-evoked EPSCs were larger in CC than CT cells over a range of light intensities (n = 6 pairs from 4 mice). (H) Short-term dynamics of ChR2-evoked VPm responses (EPSC peak) across 10 Hz trains were similar for CC and CT cells (n = 12 pairs from 7 mice). Summary statistics (EPSP threshold intensity (data not shown): CT = 0.44 ± 0.09 mW; CC cells = 0.32 ± 0.06 mW; n = 17 pairs from 9 mice; one pair was not included because the CT cell did not respond; p = 4.88 × 10⁻⁴; two-tailed paired Wilcoxon signed-rank test; EPSC peak (D): CT cells = 448.3 ± 103.5 pA; CC cells = 848.8 ± 163.4 pA; n = 13 pairs from 7 mice, p = 7.32 × 10⁻⁴, two-tailed paired Wilcoxon signed-rank test; EPSC charge (E): CT cells = 1.52 ± 0.34 pC; CC cells = 3.36 ± 0.54 pC; n = 13 pairs from 7 mice, p = 4.88 × 10⁻⁴, two-tailed paired Wilcoxon signed-rank test; EPSP peak (F): CT cells = 7.9 ± 1.2 mV; CC cells = 15.8 ± 1.6 mV; n = 18 pairs from 9 mice, p = 3.40 × 10⁻⁵, two-tailed paired t-test). Data are represented as mean ± SEM. See also Figure S6.
Figure 6
Figure 6. POm-evoked synaptic responses in pyramidal neurons of L6a
(A) (Left) Low-magnification fluorescence image taken of a fixed thalamocortical (TC) section (40 μm) showing EYFP expression 11 days after injecting a virus (AAV2) carrying genes for ChR2-EYFP into the POm of a Ntsr1:tdTomato mouse. The section was counter-stained with DAPI. (Right) High-magnification image showing EYFP-labeled POm axons in L5a, L4 septa, and L1 (inset; scale 100 μm). Arrows in inset point to both POm (green) and L6 CT (red) processes in L1. (B) Schematic of the recording configuration. (C) EPSCs and EPSPs for a L6a CT and CC cell pair in response to activation of POm axons (voltage-clamp at −94 mV and current-clamp at −84 mV; 1 ms pulse duration; traces represent the average of 16 voltage-clamp and 9 current-clamp trials). Light intensities were ~3x threshold for evoking an EPSP in CC cells (mean power = 4.9 ± 1.0 mW, n = 14 pairs from 7 mice). (D–F) Summary data plots. Blue triangles represent means. (G) POm-evoked EPSCs were much larger in CC than CT cells over a range of light intensities (n = 8 pairs from 5 mice). (H) Short-term dynamics of POm-evoked responses (EPSCs) across 10 Hz trains for CC cells (n = 11 neurons from 5 mice). Summary statistics (EPSC peak (D): CT cells = 19.1 ± 3.1 pA; CC cells = 145.0 ± 19.9 pA; n = 13 pairs from 7 mice, p = 2.44 × 10⁻⁴, two-tailed paired Wilcoxon signed-rank test; EPSC charge (E): CT cells = 0.02 ± 0.01 pC; CC cells = 0.52 ± 0.08 pC; n = 13 pairs from 7 mice, p = 2.35 × 10⁻⁵, two-tailed paired t-test; EPSP peak (F): CT cells = 0.5 ± 0.1 mV; CC cells = 3.9 ± 0.6 mV; n = 14 pairs from 7 mice, p = 1.22 × 10⁻⁴, two-tailed paired Wilcoxon signed-rank test). Data are represented as mean ± SEM. See also Figure S7 and S8.
Figure 7
Figure 7. Schematic illustration of the excitatory circuitry in L6a infrabarrels and surrounding septa
(Left, Input) CT cells in upper L6 are densest in the infrabarrels (green shadows), which are aligned with L4 barrels (gray). In contrast, CC projection cells are more prevalent in the surrounding septa. CC cells receive strong excitatory input from both VPm and POm thalamic nuclei, whereas CT cells receive weaker thalamocortical input, exclusively from the VPm. (Right, Output) Previous work has shown that CT neurons in upper L6 project their axons to the thalamus and vertically within their home cortical column, whereas CC neurons have horizontally projecting axons that target infragranular layers of neighboring cortical columns and other cortical areas (Zhang and Deschenes, 1997). These two distinct excitatory circuits are also partially segregated from each other; local synaptic connections between CT and CC neurons are generally sparse and unidirectional. and most likely to go from CC cells to CT cells.

References

    1. Agmon A, Connors BW. Thalamocortical responses of mouse somatosensory (barrel) cortex in vitro. Neuroscience. 1991;41:365–379. - PubMed
    1. Agmon A, Yang LT, O’Dowd DK, Jones EG. Organized growth of thalamocortical axons from the deep tier of terminations into layer IV of developing mouse barrel cortex. J Neurosci. 1993;13:5365–5382. - PMC - PubMed
    1. Ahissar E, Sosnik R, Haidarliu S. Transformation from temporal to rate coding in a somatosensory thalamocortical pathway. Nature. 2000;406:302–306. - PubMed
    1. Alloway KD. Information processing streams in rodent barrel cortex: the differential functions of barrel and septal circuits. Cerebral cortex. 2008;18:979–989. - PubMed
    1. Alloway KD, Zhang M, Chakrabarti S. Septal columns in rodent barrel cortex: functional circuits for modulating whisking behavior. J Comp Neurol. 2004;480:299–309. - PubMed

LinkOut - more resources