. 2018 Aug;142(2):424-434.e10.
doi: 10.1016/j.jaci.2017.08.041. Epub 2017 Dec 11.

Associations between infant fungal and bacterial dysbiosis and childhood atopic wheeze in a nonindustrialized setting

Affiliations

Associations between infant fungal and bacterial dysbiosis and childhood atopic wheeze in a nonindustrialized setting

Marie-Claire Arrieta et al. J Allergy Clin Immunol. 2018 Aug.

Abstract

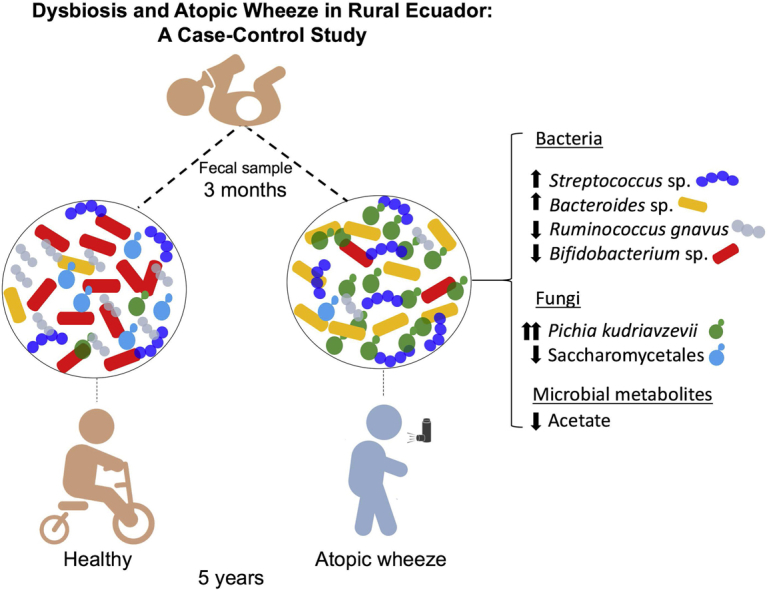
Background: Asthma is the most prevalent chronic disease of childhood. Recently, we identified a critical window early in the life of both mice and Canadian infants during which gut microbial changes (dysbiosis) affect asthma development. Given geographic differences in human gut microbiota worldwide, we studied the effects of gut microbial dysbiosis on atopic wheeze in a population living in a distinct developing world environment.

Objective: We sought to determine whether microbial alterations in early infancy are associated with the development of atopic wheeze in a nonindustrialized setting.

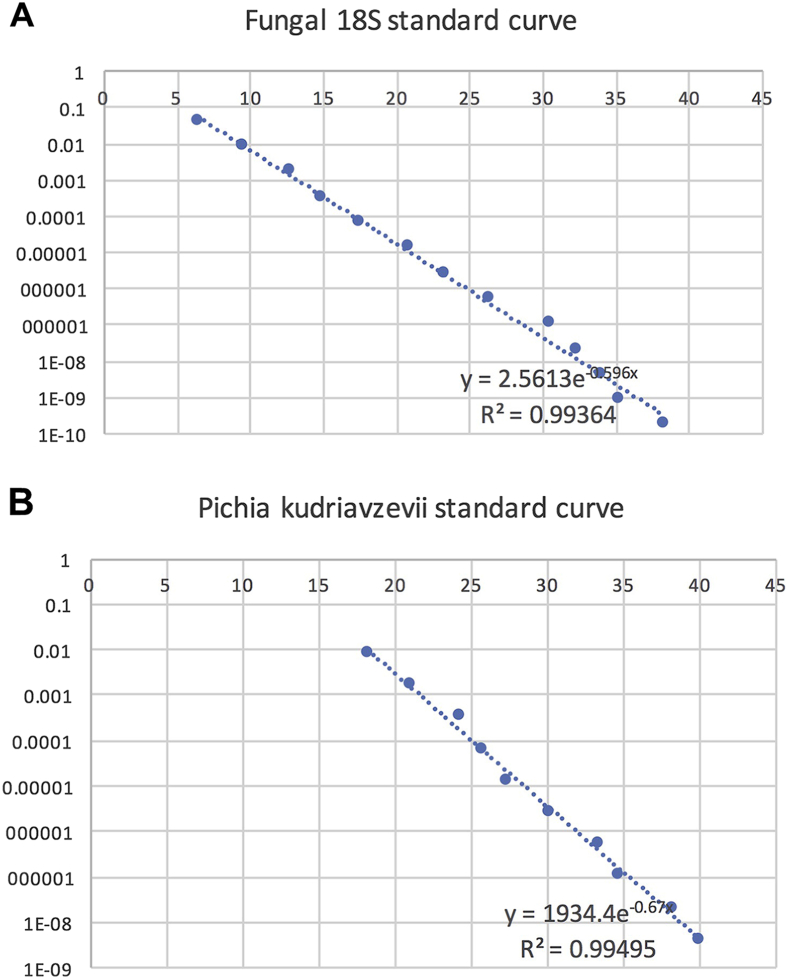
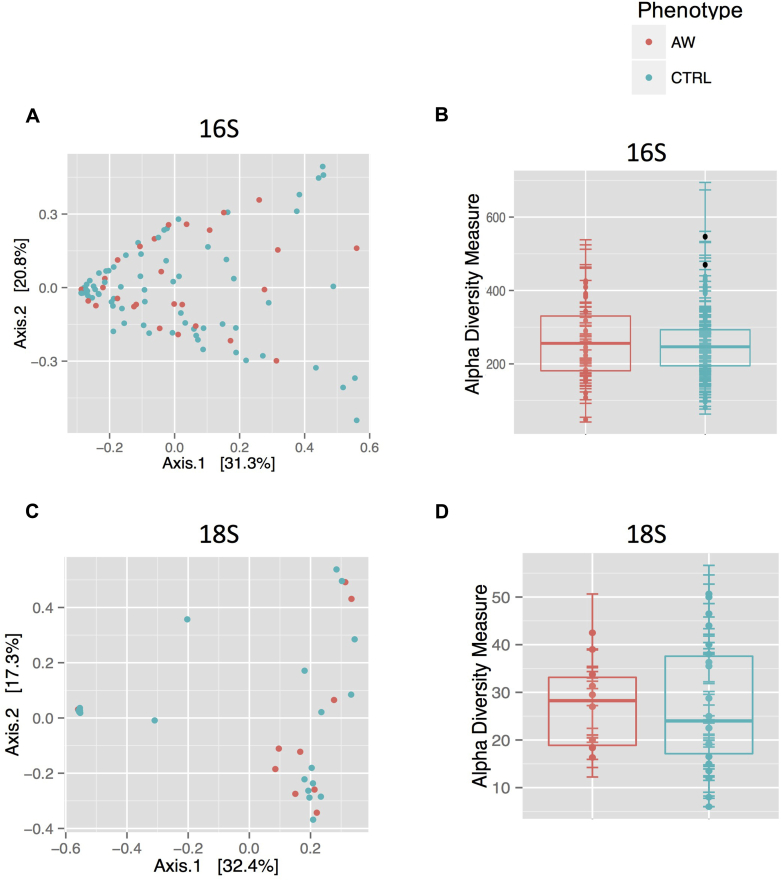
Methods: We conducted a case-control study nested within a birth cohort from rural Ecuador in which we identified 27 children with atopic wheeze and 70 healthy control subjects at 5 years of age. We analyzed bacterial and eukaryotic gut microbiota in stool samples collected at 3 months of age using 16S and 18S sequencing. Bacterial metagenomes were predicted from 16S rRNA data by using Phylogenetic Investigation of Communities by Reconstruction of Unobserved States and categorized by function with Kyoto Encyclopedia of Genes and Genomes ontology. Concentrations of fecal short-chain fatty acids were determined by using gas chromatography.

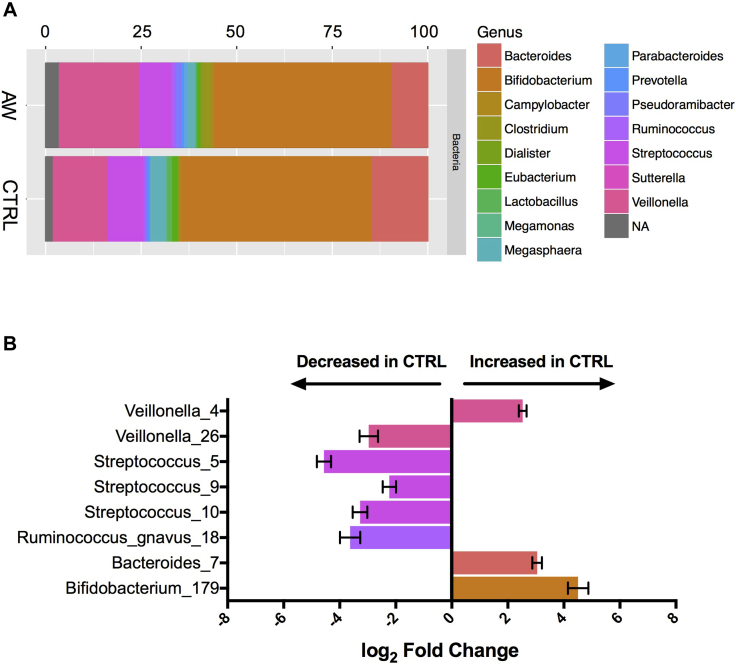
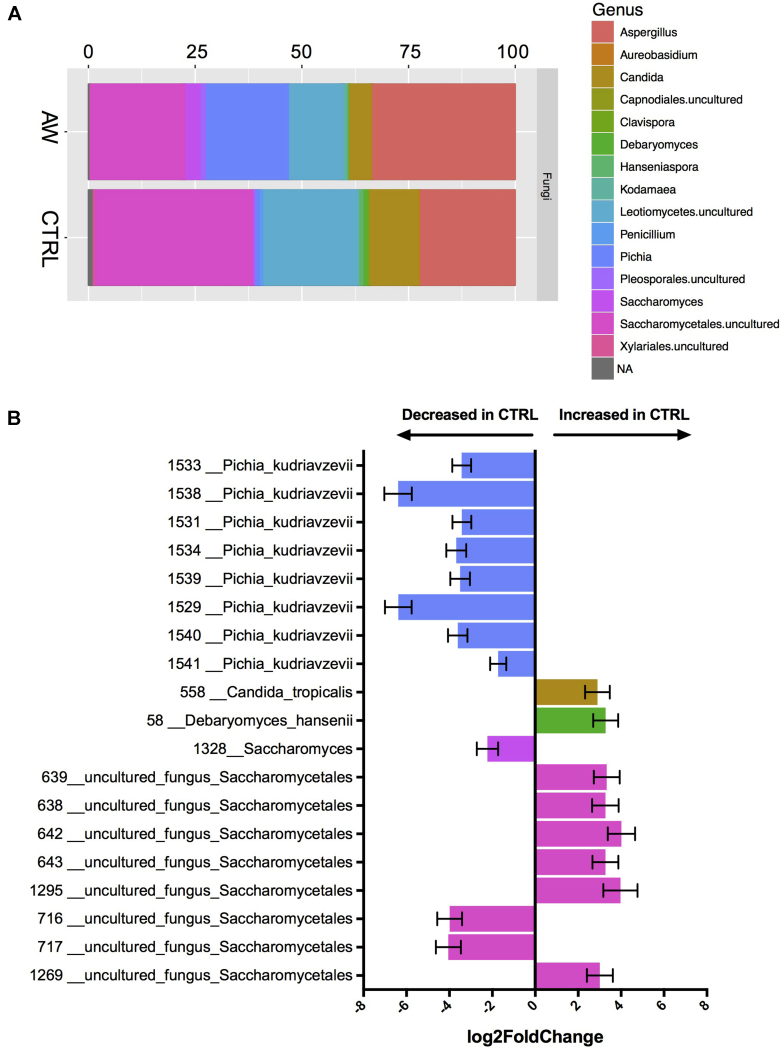
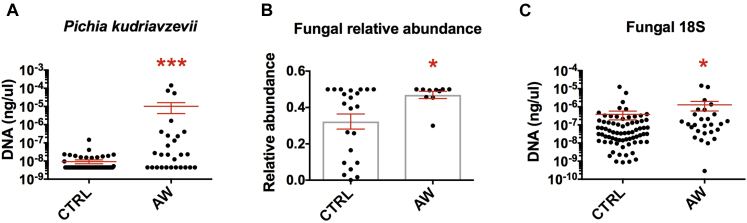
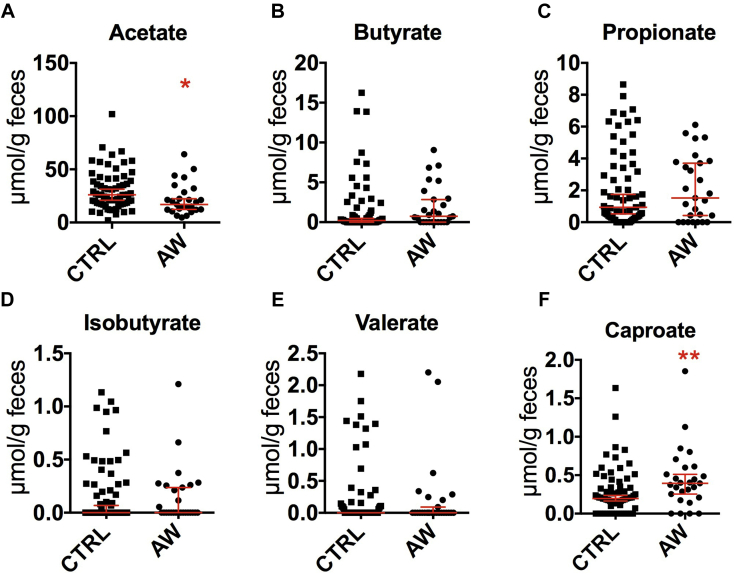
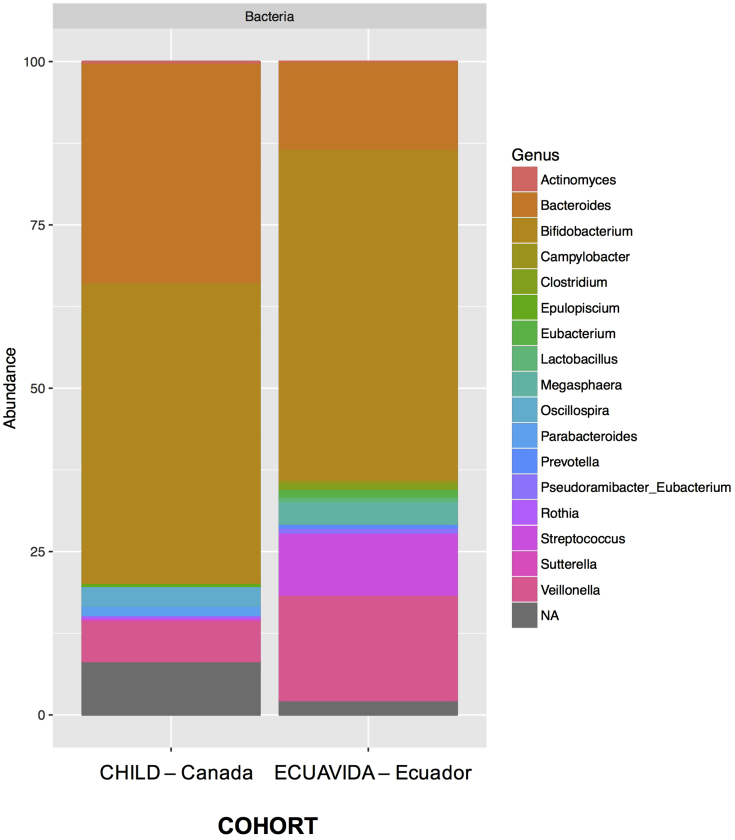
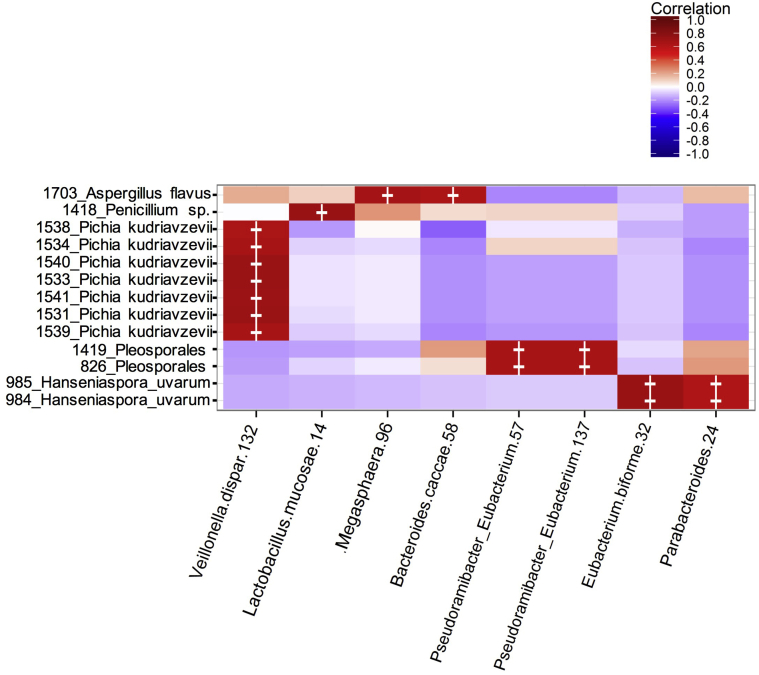
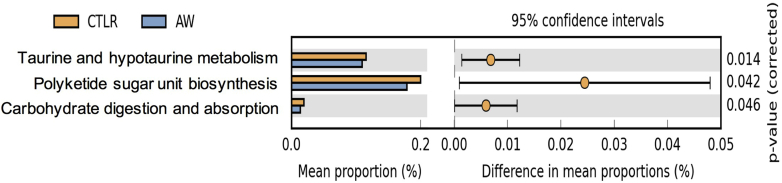
Results: As previously observed in Canadian infants, microbial dysbiosis at 3 months of age was associated with later development of atopic wheeze. However, the dysbiosis in Ecuadorian babies involved different bacterial taxa, was more pronounced, and also involved several fungal taxa. Predicted metagenomic analysis emphasized significant dysbiosis-associated differences in genes involved in carbohydrate and taurine metabolism. Levels of the fecal short-chain fatty acids acetate and caproate were reduced and increased, respectively, in the 3-month stool samples of children who went on to have atopic wheeze.

Conclusions: Our findings support the importance of fungal and bacterial microbiota during the first 100 days of life on the development of atopic wheeze and provide additional support for considering modulation of the gut microbiome as a primary asthma prevention strategy.

Keywords: Asthma; atopy; gut microbiome; mycobiome; nonindustrialized setting; short-chain fatty acids; wheeze.


Figures

None
Graphical abstract
Fig 1
Fig 1
Bacterial dysbiosis associated with development of atopic wheeze. A, Relative abundance of bacterial genera within the top 100 OTUs among the 2 phenotypes at 3 months. Rectangle colors correspond to the bacterial genera in the legend. Rectangles represent merged OTUs belonging to the same genus. NA, OTUs without genus-level taxonomic assignment. B, Log fold change of OTUs that are significantly (false discovery rate < 0.05) abundant between AWs and control subjects calculated by using DESeq2. Error bars denote SDs. Taxonomic identification and OTU numbers are denoted on the y-axis.
Fig 2
Fig 2
Fungal dysbiosis associated with development of atopic wheeze. A, Relative abundance of fungal genera within the top 100 OTUs among the 2 phenotypes at 3 months. Rectangle colors correspond to fungal genera in the legend. Rectangles represent merged OTUs belonging to the same genus or higher taxa if genus information was not obtained in the analysis. NA, OTUs without genus-level taxonomic assignment. B, Log fold change of OTUs significantly (false discovery rate < 0.05) abundant between AWs and control subjects calculated by using DESeq2. Error bars denote SDs. Taxonomic identification and OTU numbers are denoted on the y-axis.
Fig 3
Fig 3
Fungus-specific qPCR and Illumina sequence data. A, qPCR quantification (standard curve method) of P kudriavzevii in feces of 3-month-old infants from the ECUAVIDA study (control subjects, 68; AWs, 27). B, Relative abundance of fungal reads over the total number of eukaryotic reads from 18S data set. Only samples with more than 1000 sequences after filtering were included in the 18S high-throughput sequencing analysis (control subjects, 23; AWs, 10). C, qPCR quantification (standard curve method) of fungus-specific 18S copies in feces of 3-month-old infants from the ECUAVIDA study (control subjects, 68; AWs, 27). In Fig 3, A and C, graphs are based on a logarithmic scale. All graphs show Mann-Whitney tests: *P < .05 and ***P < .001.
Fig 4
Fig 4
Concentration of the 6 most abundant SCFAs in feces of infants with atopic wheeze and control infants at 3 months of age measured by using gas chromatography and normalized to feces wet weight. Acetate (A), butyrate (B), propionate (C), isobutyrate (D), valerate (E), and caproate (F). (AWs, 27; control subjects, 70; *P < .05 and **P < .01, Mann-Whitney test).
Fig E1
Fig E1
Standard curves for fungus-specific 18S (A) and P kudriavzevii(B) qPCR reactions. Standard curves were generated by using 1:5 dilutions of a 1 ng/μL stock of 18S amplicons obtained from PCR reactions done with fungus-specific 18S primers (FR1 and FF390) and purified P kudriavzevii template DNA (see the Methods section). DNA concentrations are denoted in logarithmic scale (y-axis) in relation to PCR cycle number (x-axis). Exponential trend lines and equations, as well as R2 values, are included in each graph.
Fig E2
Fig E2
Relative abundance of the 100 most abundant bacterial OTUs in feces of Canadian versus Ecuadorian 3-month-old infants. Rectangle colors correspond to the bacterial genera in the legend. Rectangles represent merged OTUs belonging to the same genus. NA, OTUs without genus-level taxonomic assignment.
Fig E3
Fig E3
Both α (A and C; Chao1 index) and β (B and D; principal coordinates analysis [Bray-Curtis]) bacterial (Fig E3, A and B) and fungal (Fig E3, C and D) diversity in fecal samples from 3-month-old infants who presented with atopic wheeze at 5 years (AW) versus healthy control subjects (CTRL). Sequencing results from all 16S samples and from 33 18S samples (control subjects, 23; AWs, 10) were retained after applying a cutoff of 1000 sequences per sample. The atopic wheeze phenotype did not explain significant changes in these measurements (P = .323 and .676 [Mann-Whitney test and permutational multivariate ANOVA] for Fig E3, A and C, respectively).
Fig E4
Fig E4
Heat map of biweight correlations between the top 100 bacterial (x-axis) and top 100 fungal (y-axis) OTUs in 33 fecal samples (control subjects, 23; AWs, 10) from 3-month-old infants recruited in the ECUAVIDA cohort study. Significant correlation values are denoted with a cross (P < .05, false discovery rate).
Fig E5
Fig E5
Phylogenetic placement of P kudriavzevii OTUs within Pichia species sequences from the SILVA 123 reference database. 18S ribosomal DNA sequences labeled as Pichia species or Pichiaceae in the 99% SILVA reference database were aligned and then used to construct a reference tree with RAxML. OTUs from this study assigned to Pichia species were placed in this tree with the RAxML evolutionary placement algorithm. All OTUs cluster within a clade of P kudriavzevii.
Fig E6
Fig E6
PICRUSt-predicted Kyoto Encyclopedia of Genes and Genomes functional categories with significant differences in relative abundance between control subjects and AWs (Welch t test, q values are shown in figure).

References

    1. Asher I., Pearce N. Global burden of asthma among children. Int J Tuberc Lung Dis. 2014;18:1269–1278. - PubMed
    1. Martinez F.D., Vercelli D. Asthma. Lancet. 2013;382:1360–1372. - PMC - PubMed
    1. Arrieta M.C., Stiemsma L.T., Amenyogbe N., Brown E.M., Finlay B. The intestinal microbiome in early life: health and disease. Front Immunol. 2014;5:427. - PMC - PubMed
    1. Russell S.L., Gold M.J., Hartmann M., Willing B.P., Thorson L., Wlodarska M. Early life antibiotic-driven changes in microbiota enhance susceptibility to allergic asthma. EMBO Rep. 2012;13:440–447. - PMC - PubMed
    1. Russell S.L., Gold M.J., Reynolds L.A., Willing B.P., Dimitriu P., Thorson L. Perinatal antibiotic-induced shifts in gut microbiota have differential effects on inflammatory lung diseases. J Allergy Clin Immunol. 2015;135:100–109. - PubMed

Publication types