. 2018 Jan 26;359(6374):470-473.
doi: 10.1126/science.aao3099. Epub 2017 Dec 14.

The ER membrane protein complex is a transmembrane domain insertase

Affiliations

The ER membrane protein complex is a transmembrane domain insertase

Alina Guna et al. Science. .

Abstract

Insertion of proteins into membranes is an essential cellular process. The extensive biophysical and topological diversity of membrane proteins necessitates multiple insertion pathways that remain incompletely defined. Here we found that known membrane insertion pathways fail to effectively engage tail-anchored membrane proteins with moderately hydrophobic transmembrane domains. These proteins are instead shielded in the cytosol by calmodulin. Dynamic release from calmodulin allowed sampling of the endoplasmic reticulum (ER), where the conserved ER membrane protein complex (EMC) was shown to be essential for efficient insertion in vitro and in cells. Purified EMC in synthetic liposomes catalyzed the insertion of its substrates in a reconstituted system. Thus, EMC is a transmembrane domain insertase, a function that may explain its widely pleiotropic membrane-associated phenotypes across organisms.


Figures

Fig. 1
Fig. 1
Detection of a non-TRC insertion pathway for TA proteins. (A) Diagramof the TA protein reporter cassette used for most of the analyses in this study.The asterisk at the end of the amino acid sequence indicates the stop codon. (B) 35S-methionine–labeled TA protein reporters with the indicated TMDs (see fig. S1) were translated in nucleased reticulocyte lysate (RRL) and incubated with or without canine pancreas–derived rough microsomes (RMs). Glycosylation (+ glyc) indicates successful insertion (see fig. S2). Relative hydrophobicity (hyd) values for each TMD are shown. In a parallel experiment, reactions lacking microsomes for each protein were immunoprecipitated (IP) by means of the substrate’s FLAG tag and analyzed for TRC40 association (by immunoblot) and substrate (by autoradiography, autorad). Identical results were obtained in native RRL. (C and D) Relative normalized insertion efficiencies for the indicated TA proteins with increasing amounts of the coiled-coil domain of the protein WRB (WRB-CC), a fragment of the TRC40 receptor at the ER (see fig. S3A). (E) An experiment as in (B) for a set of SQS mutants that successively increase TMD hydrophobicity through leucine (L) residue substitutions (fig. S1). (F) Analysis of SQS and VAMP2 insertion using ER microsomes from HEK293 cells (hRM) or trypsin-digested hRM (tRM; see fig. S3D). Single-letter abbreviations for the amino acid residues are as follows: D, Asp; E, Glu; F, Phe; G, Gly; K, Lys; M, Met; N, Asn; P, Pro; S, Ser; T, Thr; V, Val; and Y, Tyr.
Fig. 2
Fig. 2
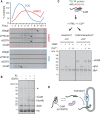
Identification of cytosolic factors that maintain TA protein insertion competence. (A) 35S-methionine–labeled SQS and VAMP2 were translated in native RRL, separated by size on a sucrose gradient, and subjected to chemical cross-linking of each fraction using amine- or sulfhydryl-reactive cross-linker (indicated with an x) (see fig. S5 for full gels). The graph shows the densitometry profiles of each substrate across the gradient, and the individual panels show regions of the cross-linking gels for the indicated interaction partners (verified by immunoprecipitation and mass spectrometry). (B) 35S-methionine–labeled SQS translated in native RRL was treated with or without 1 mM EGTA before cross-linking and analysis by SDS–polyacrylamide gel electrophoresis and autoradiography. The major SQS cross-linking partner (xCaM) is not seen with EGTA. Hemoglobin (Hb), its intersubunit cross-link (Hb-Hb), and an unspecified translation product (*) are indicated. XL, cross-linker. (C) 35S-methionine–labeled SQS containing the benzoyl-phenylalanine photo–cross-linker within the TMD was produced as a defined complex with CaM by using the PURE system (protein expression using recombinant elements; see fig. S6). The isolated SQS-CaM complex, prepared in 100 nM Ca2+, was incubated with RM in the absence and presence of excess Ca2+ (either 0.2 or 0.5 mM) and analyzed directly (left) or irradiated with ultraviolet (UV) light to induce cross-linking before analysis (right). The glycosylated (+ glyc) and CaM–cross-linked (xCaM) products are indicated. (D) Schematic of the SQS insertion pathway, with a hypothetical membrane factor indicated with a question mark.
Fig. 3
Fig. 3
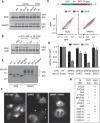
The EMC is essential for TA protein insertion in vitro and in cells. (A) Semipermeabilized cells (see fig. S13B) fromwild-type (WT) and knockout (D) cells of the indicated cell lines were tested for insertion of SQS and VAMP2 by using the glycosylation assay.The “–” indicates a control reaction lacking semipermeabilized cells. (B) The isolated SQS-CaM complex (fig. S6) was tested for insertion into cRM or different amounts of hRM from WTor DEMC6 (D6) HEK293 cell lines. (C) Flow cytometry analysis of RFP-SQS and RFP-VAMP2, relative to an internal green fluorescent protein (GFP) expression control (see fig. S15A), in WT (gray), DEMC6 (red), or DEMC6+EMC6 (rescue, blue) cell lines. Although the RFP:GFP ratio remains close to 1 for VAMP2 across a wide range of expression levels in all cell lines, SQS is selectively decreased in DEMC6 cells, especially at low expression levels (see fig. S15B for histograms of these data). 2A, viral 2A peptide. (D) Tabulatedmean RFP: GFP ratios for SQS (gray bars) and VAMP2 (black bars) in the indicated cell lines.The results for each construct were normalized to the value in WTcells and depict mean ± SD from three independent experiments. (E) Immunoblots for SQS-RFP and VAMP2-RFP in the indicated cell lines. Loadingwas normalized to equivalent amounts of GFP expression as determined by flow cytometry. An aliquot of the WTsample digested with peptide N-glycosidase (PNGase) is shown as a marker for nonglycosylated substrate. Glycosylation of the ER-resident SQS is limited to the core N-glycan, whereas VAMP2 acquires complex glycans because of trafficking through the Golgi. (F) Live cell images of GFP-SQS in the indicated cell lines show altered localization in DEMC6 cells. In lowexpressing cells (yellow arrows), the localization is diffusely cytosolic, whereas punctae, presumably representing aggregates, are seen in high-expressing cells (red arrows).VAMP2 was unchanged in its localization in DEMC6 cells (fig. S15C). (G) Summary of dependence on either TRC40 (as judged by inhibitory effect of WRB-CC in Fig. 1) or EMC (see fig. S16) for the indicated substrates.
Fig. 4
Fig. 4
Reconstitution of EMC-dependent TA protein insertion with purified factors. (A) SYPRO Ruby–stained gel of anti-FLAG (a-FLAG) affinity purification from HEK293 cells expressing untagged or FLAGtagged EMC5. (B) Diagram of the protease-protection assay for TA protein insertion using a C-terminal epitope tag (red) to selectively recover the protected fragment (PF) diagnostic of successful insertion. PK, proteinase K; IP, immunoprecipitation. (C) Liposomes reconstituted with or without purified EMC were analyzed for insertion of SQS or VAMP2 synthesized in native RRL. For comparison, native ER microsomes (hRM) from WT or DEMC6 HEK293 cells were tested in parallel. Immunoblot for EMC2 indicates the relative amounts of EMC. As shown in fig. S18, roughly onethird of EMC in the proteoliposomes is in the correct orientation. The graph represents four experiments (mean ± SD), normalized to insertion in WT hRM. (D) Liposomes reconstituted with a constant amount of lipids and varying amounts of purified EMC were analyzed by protease protection for insertion relative to WT and DEMC6 hRM. The isolated SQS-CaM complex, an aliquot of which is shown in the last lane, was the substrate for these assays. The samples were also immunoblotted for EMC2 to visualize relative EMC amounts. The graph represents four experiments (mean ± SD) normalized to insertion in WT hRM.

Comment in

References

    1. Kalbfleisch T, Cambon A, Wattenberg B. W, Traffic 8, 1687–1694 (2007). - PubMed
    1. Hegde R. S, Keenan R. J, Nat. Rev. Mol. Cell Biol. 12, 787–798 (2011). - PMC - PubMed
    1. Mateja A, et al. , Science 347, 1152–1155 (2015). - PMC - PubMed
    1. Mariappan M, et al. , Nature 477, 61–66 (2011). - PMC - PubMed
    1. Stefer S, et al. , Science 333, 758–762 (2011). - PMC - PubMed

Publication types