. 2018 Feb;208(2):513-523.
doi: 10.1534/genetics.117.300344. Epub 2017 Dec 13.

Comparative Oligo-FISH Mapping: An Efficient and Powerful Methodology To Reveal Karyotypic and Chromosomal Evolution

Affiliations

Comparative Oligo-FISH Mapping: An Efficient and Powerful Methodology To Reveal Karyotypic and Chromosomal Evolution

Guilherme T Braz et al. Genetics. 2018 Feb.

Abstract

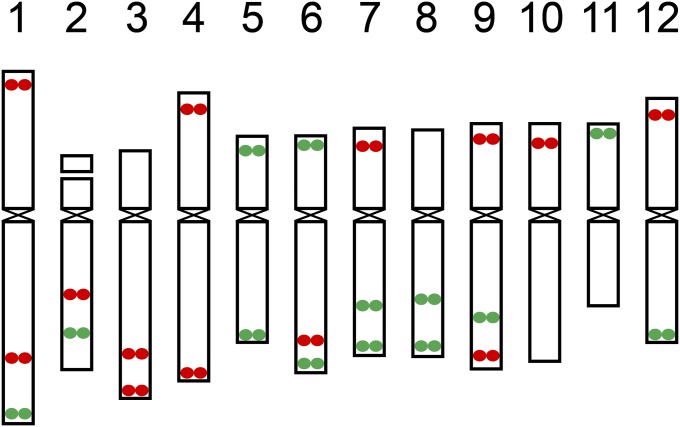
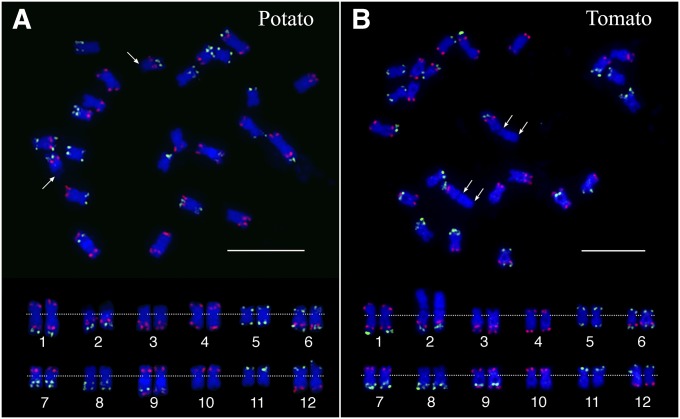
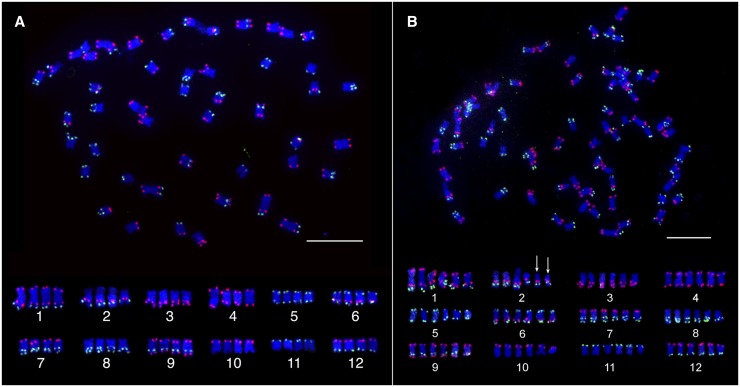
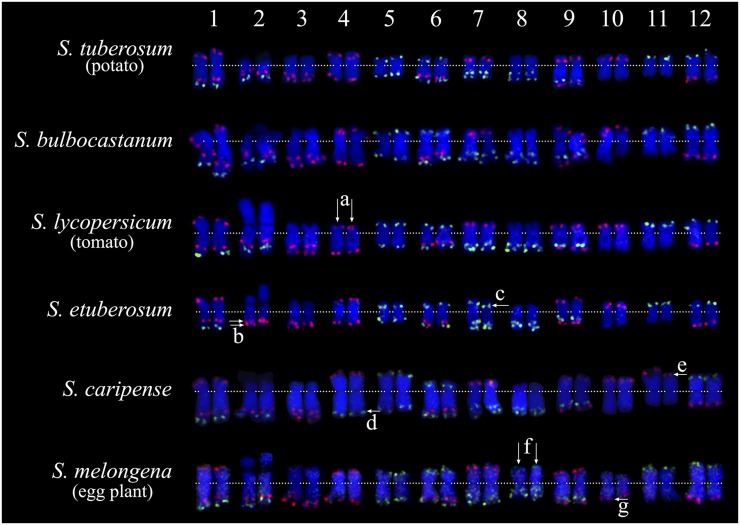
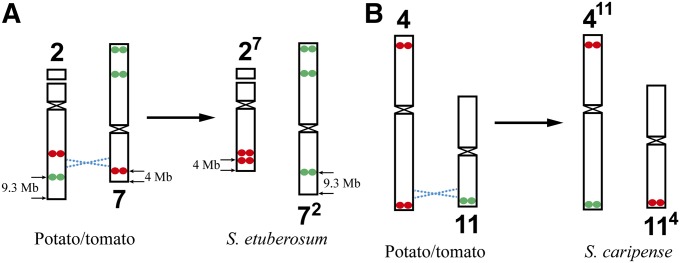
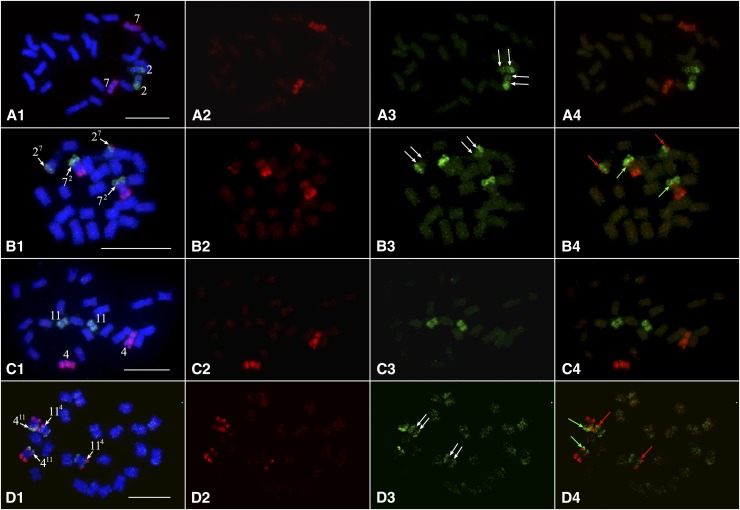
Developing the karyotype of a eukaryotic species relies on identification of individual chromosomes, which has been a major challenge for most nonmodel plant and animal species. We developed a novel chromosome identification system by selecting and labeling oligonucleotides (oligos) located in specific regions on every chromosome. We selected a set of 54,672 oligos (45 nt) based on single copy DNA sequences in the potato genome. These oligos generated 26 distinct FISH signals that can be used as a "bar code" or "banding pattern" to uniquely label each of the 12 chromosomes from both diploid and polyploid (4× and 6×) potato species. Remarkably, the same bar code can be used to identify the 12 homeologous chromosomes among distantly related Solanum species, including tomato and eggplant. Accurate karyotypes based on individually identified chromosomes were established in six Solanum species that have diverged for >15 MY. These six species have maintained a similar karyotype; however, modifications to the FISH signal bar code led to the discovery of two reciprocal chromosomal translocations in Solanum etuberosum and S. caripense We also validated these translocations by oligo-based chromosome painting. We demonstrate that the oligo-based FISH techniques are powerful new tools for chromosome identification and karyotyping research, especially for nonmodel plant species.

Keywords: chromosome identification; chromosome painting; karyotype; oligo-FISH; translocation.


Figures

Figure 1
Figure 1
Predicted locations of the oligo-FISH signals on 12 potato chromosomes. Oligos were selected from a total of 26 chromosomal regions (13 red regions and 13 green regions). The 12 chromosomes can be distinguished from each other based on number and location of the red/green signals. The centromere positions on the 12 chromosomes in the potato reference genome were based on the locations of sequences associated with CENH3 nucleosomes (Gong et al. 2012).
Figure 2
Figure 2
FISH mapping of potato and tomato chromosomes using two oligo-FISH probes. (A) FISH mapping of DM potato. Arrows point to the 45S rDNA regions associated with chromosome 2 (FISH mapping of the 45S rDNA on the same metaphase cell is shown in Figure S1 in File S1). The rDNA region is distinctly decondensed compared to the rest of the chromosome. (B) FISH mapping of tomato. The double arrows indicate the extent of the 45S rDNA regions (FISH mapping of the 45S rDNA on the same metaphase cell is shown in Figure S1 in File S1). The rDNA region is similarly condensed compared with the rest of the chromosome. The top panels show a complete metaphase cell from potato and tomato, respectively. Homologous chromosomes in the bottom panel were digitally excised from the same cells and paired. The centromeres of the chromosomes are aligned by a dotted line. Bar, 10 µm.
Figure 3
Figure 3
Chromosome identification in polyploid Solanum species. (A) Chromosome identification of potato cultivar Katahdin. The top panel shows a complete metaphase cell hybridized with two oligo-FISH probes. The bottom panel shows the 4 homologous chromosomes of each of the 12 potato chromosomes digitally excised from the same cell. (B) Chromosome identification in the hexaploid species S. demissum. The top panel shows a complete metaphase cell hybridized with two oligo-FISH probes. The bottom panel shows the 6 homologous chromosomes of each of the 12 potato chromosomes digitally excised from the same cell. The two arrows indicate the two copies of chromosome 2 that are not associated with 45S rDNA (FISH mapping of the 45S rDNA is showed in Figure S2 in File S1). Bar, 10 µm.
Figure 4
Figure 4
Comparative karyotyping of six diploid Solanum species. Chromosomes 1–12 from each species are arranged from left to right. Karyotypes of potato and tomato were developed from the same metaphase cells in Figure 2. Karyotypes of the remaining four species are developed from the same metaphase cells in Figure S4 in File S1. (a) Double arrows point to the two copies of tomato chromosome 4, which have a distinct arm ratio compared to chromosome 4 from other species. (b) Double arrows point to two closely linked red signals on S. etuberosum chromosome 2, the bottom red signal is predicted to be derived from the short arm of chromosome 7. For comparison, we used the karyotype of potato as our reference, see switches between red and green signals among these two species. (c) Arrow indicates the green signal on the short arm of S. etuberosum chromosome 7, which is predicted to be derived from the long arm of chromosome 2. (d) Arrow points to the green signal on the long arm of S. caripense chromosome 4, which is predicted to be derived from the short arm of chromosome 11. (e) Arrow points to the red signal on S. caripense chromosome 11, which is predicted to be derived from the long arm of chromosome 4. (f) Double arrows point to the two copies of eggplant chromosome 8, which have a distinctly large short arm compared to chromosome 8 from other species. (g) Arrow indicates the location of the red signal on the long arm of eggplant chromosome 10. This signal is located at the short arm of chromosome 10 from other species.
Figure 5
Figure 5
Predicted reciprocal chromosomal translocations identified in Solanum species. (A) A reciprocal translocation between chromosomes 2 and 7 in S. etuberosum. Chromosomes 2 and 7 from potato/tomato are hypothesized to be the ancestral types. A reciprocal translocation (dashed blue lines) is predicted based on the modifications to the oligo-FISH bar code, which result in the two translocation chromosomes 27 and 72, respectively, in S. etuberosum. (B) A reciprocal translocation between chromosomes 4 and 11 in S. caripense. The chromosomes 4 and 11 from potato/tomato are hypothesized to be the ancestral types. A reciprocal translocation (dashed blue lines) is predicted based on the modifications of the oligo-FISH bar code, which result in the two translocation chromosomes 411 and 114, respectively, in S. caripense.
Figure 6
Figure 6
Validation of chromosomal translocations by chromosome painting. (A1–A4) Painting of chromosomes 2 (green) and 7 (red) of DM potato. Red (A2), green (A3), and both red and green (A4) fluorescence signals were digitally separated from (A1). Double white arrows in (A3) indicate relatively weak FISH signals that span the short arm and proximal region of the long arm of chromosome 2. (B1–B4) Painting of chromosomes 2 (green) and 7 (red) in S. etuberosum. Red (B2), green (B3), and both red and green (B4) fluorescence signals were digitally separated from (B1). Double white arrows in (B3) indicate very weak or background level FISH signals that span the short arm and proximal region of the long arm of chromosome 2. Red arrows in (B4) point to the breakpoint where a small chromosome 7 fragment attached to chromosome 2 (27). Green arrows in B4 point to the breakpoint where a large chromosome 2 fragment attached to chromosome 7 (72). (C1–C4) Painting of chromosomes 4 (red) and 11 (green) of DM potato. Red (C2), green (C3), and both red and green (C4) fluorescence signals were digitally separated from (C1). (D1–D4) Painting of chromosomes 4 (red) and 11 (green) in S. caripense. Red (D2), green (D3), and both red and green (D4) fluorescence signals were digitally separated from (D1). Double white arrows indicate background level FISH signals that span pericentromeric region of chromosome 11. Red arrows in (D4) point to the breakpoint where a chromosome 4 fragment attached to chromosome 11 (114). Green arrows in (B4) point to the breakpoint where a chromosome11 fragment attached to chromosome 4 (411). Bar, 10 µm.

References

    1. Anderson L. K., Stack S. M., Mitchell J. B., 1982. An investigation of the basis of a current hypothesis for the lack of G-banding in plant chromosomes. Exp. Cell Res. 138: 433–436. - PubMed
    1. Badaeva E. D., Jiang J. M., Gill B. S., 1995. Detection of intergenomic translocations with centromeric and noncentromeric breakpoints in Triticum araraticum - mechanism of origin and adaptive significance. Genome 38: 976–981. - PubMed
    1. Beliveau B. J., Joyce E. F., Apostolopoulos N., Yilmaz F., Fonseka C. Y., et al. , 2012. Versatile design and synthesis platform for visualizing genomes with oligopaint FISH probes. Proc. Natl. Acad. Sci. USA 109: 21301–21306. - PMC - PubMed
    1. Bonierbale M. W., Plaisted R. L., Tanksley S. D., 1988. RFLP maps based on a common set of clones reveal modes of chromosomal evolution in potato and tomato. Genetics 120: 1095–1103. - PMC - PubMed
    1. Boyle S., Rodesch M. J., Halvensleben H. A., Jeddeloh J. A., Bickmore W. A., 2011. Fluorescence in situ hybridization with high-complexity repeat-free oligonucleotide probes generated by massively parallel synthesis. Chromosome Res. 19: 901–909. - PMC - PubMed

Publication types