

Chemokine (C-C Motif) Receptor-Like 2 is not essential for lung injury, lung inflammation, or airway hyperresponsiveness induced by acute exposure to ozone
- PMID: 29242308
- PMCID: PMC5742705
- DOI: 10.14814/phy2.13545
Chemokine (C-C Motif) Receptor-Like 2 is not essential for lung injury, lung inflammation, or airway hyperresponsiveness induced by acute exposure to ozone
Abstract
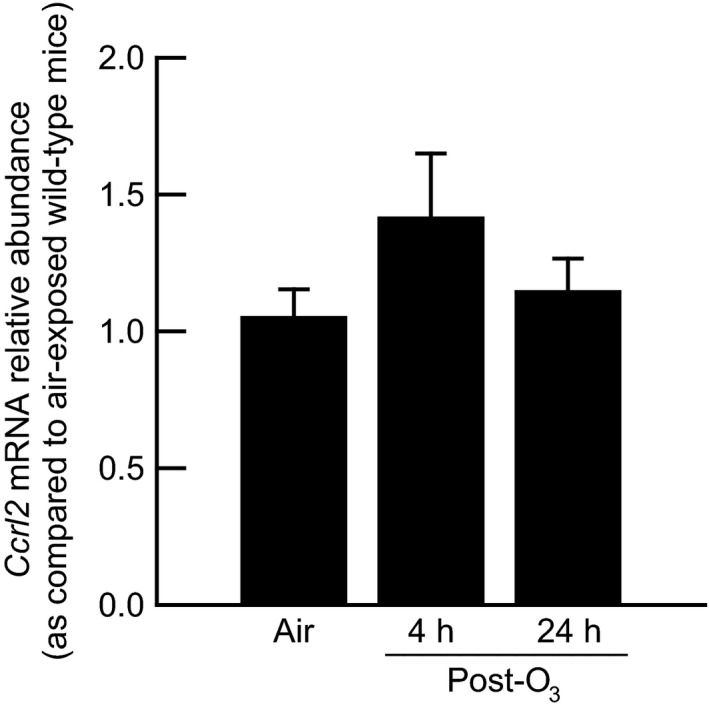
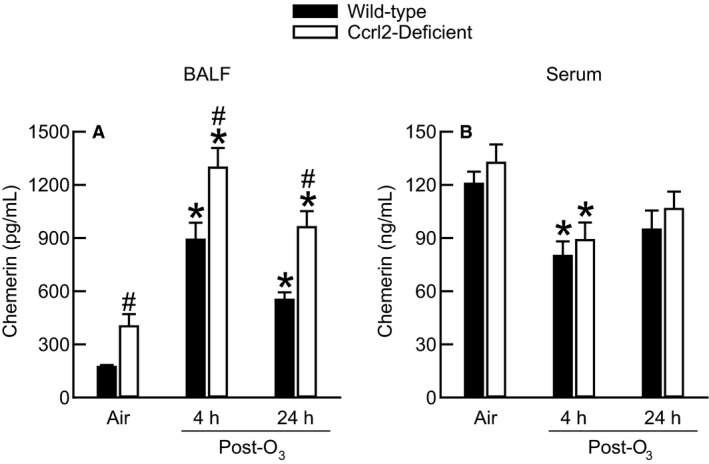
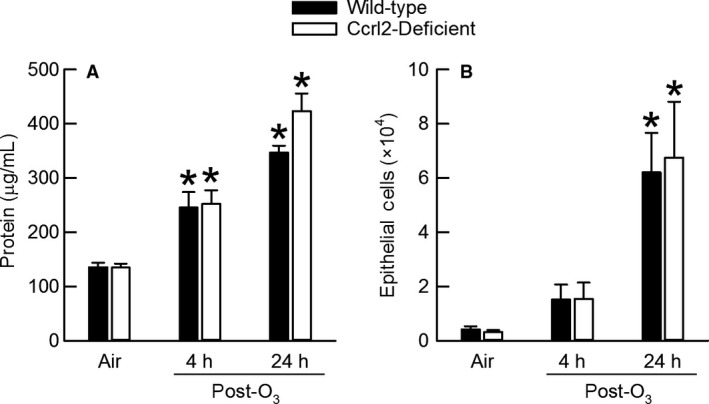
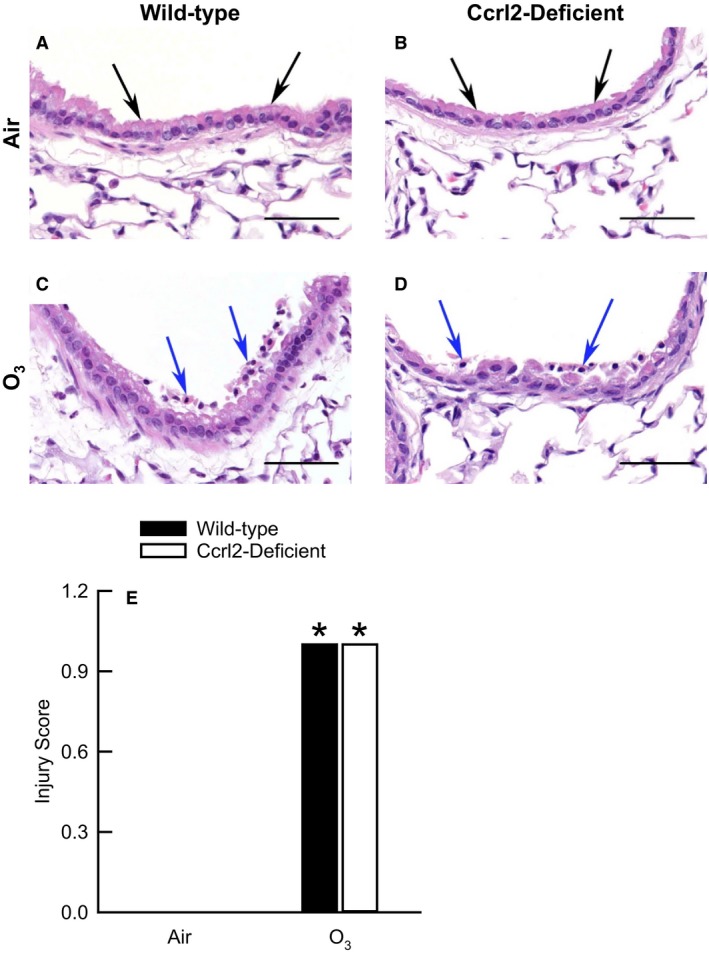
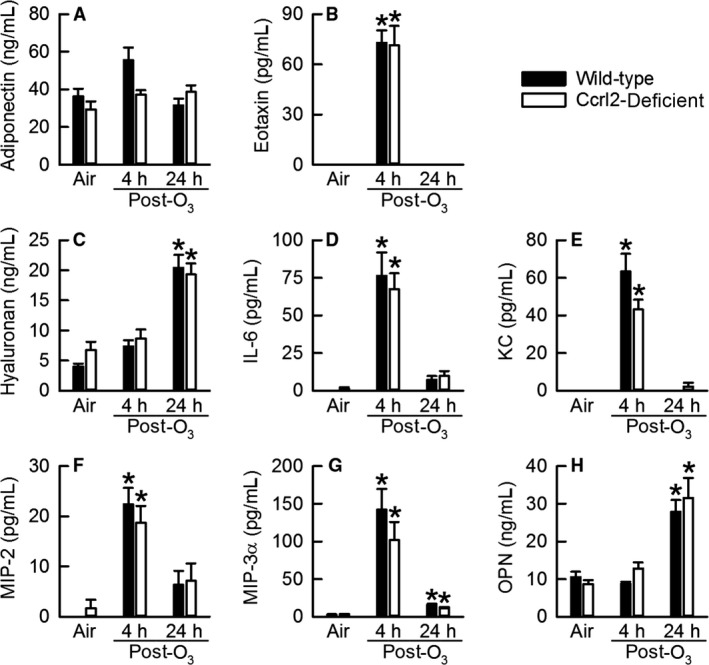
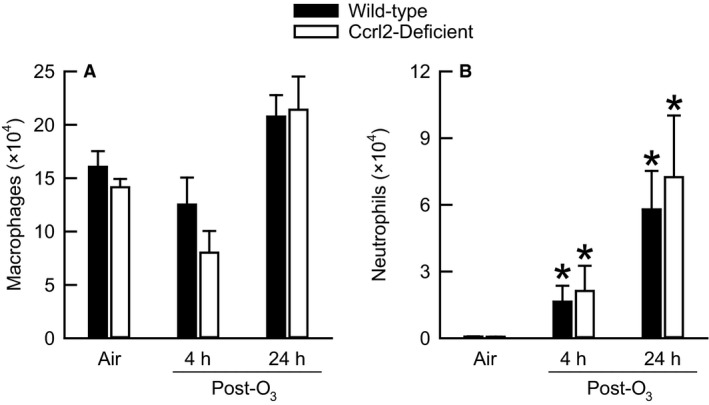
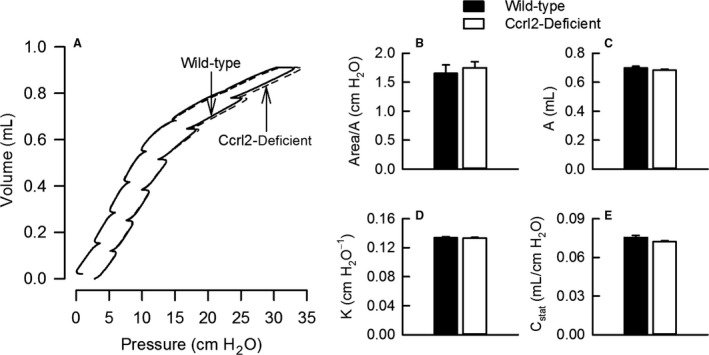
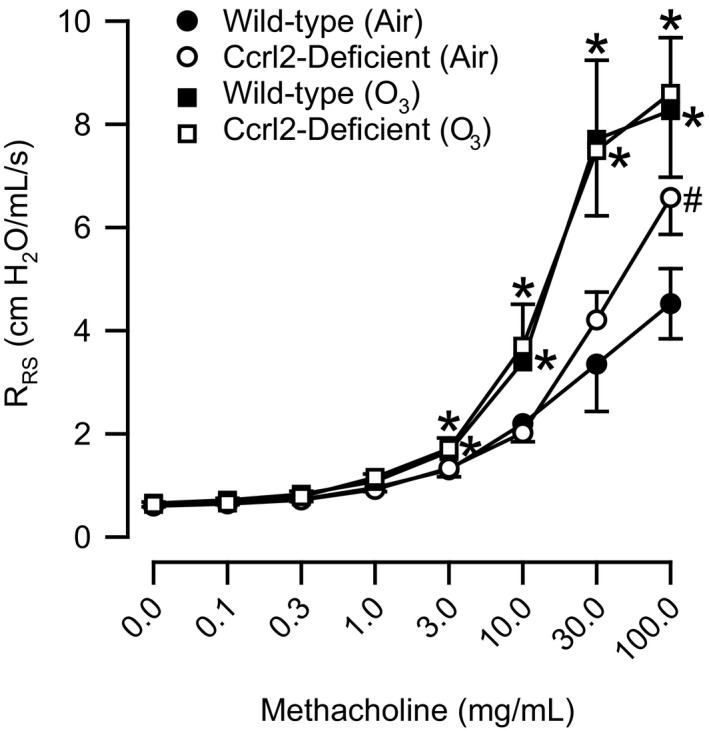
Inhalation of ozone (O3), a gaseous air pollutant, causes lung injury, lung inflammation, and airway hyperresponsiveness. Macrophages, mast cells, and neutrophils contribute to one or more of these sequelae induced by O3 Furthermore, each of these aforementioned cells express chemokine (C-C motif) receptor-like 2 (Ccrl2), an atypical chemokine receptor that facilitates leukocyte chemotaxis. Given that Ccrl2 is expressed by cells essential to the development of O3-induced lung pathology and that chemerin, a Ccrl2 ligand, is increased in bronchoalveolar lavage fluid (BALF) by O3, we hypothesized that Ccrl2 contributes to the development of lung injury, lung inflammation, and airway hyperresponsiveness induced by O3 To that end, we measured indices of lung injury (BALF protein, BALF epithelial cells, and bronchiolar epithelial injury), lung inflammation (BALF cytokines and BALF leukocytes), and airway responsiveness to acetyl-β-methylcholine chloride (respiratory system resistance) in wild-type and mice genetically deficient in Ccrl2 (Ccrl2-deficient mice) 4 and/or 24 hours following cessation of acute exposure to either filtered room air (air) or O3 In air-exposed mice, BALF chemerin was greater in Ccrl2-deficient as compared to wild-type mice. O3 increased BALF chemerin in mice of both genotypes, yet following O3 exposure, BALF chemerin was greater in Ccrl2-deficient as compared to wild-type mice. O3 increased indices of lung injury, lung inflammation, and airway responsiveness. Nevertheless, no indices were different between genotypes following O3 exposure. In conclusion, we demonstrate that Ccrl2 modulates chemerin levels in the epithelial lining fluid of the lungs but does not contribute to the development of O3-induced lung pathology.
Keywords: CXCR2; Cmklr1; Gpr1; chemerin; methacholine; osteopontin.
© 2017 The Authors. Physiological Reports published by Wiley Periodicals, Inc. on behalf of The Physiological Society and the American Physiological Society.
Figures
Similar articles
-
Inconsequential role for chemerin-like receptor 1 in the manifestation of ozone-induced lung pathophysiology in male mice.Physiol Rep. 2024 Apr;12(8):e16008. doi: 10.14814/phy2.16008. Physiol Rep. 2024. PMID: 38631890 Free PMC article.
-
Endogenous osteopontin promotes ozone-induced neutrophil recruitment to the lungs and airway hyperresponsiveness to methacholine.Am J Physiol Lung Cell Mol Physiol. 2013 Jul 15;305(2):L118-29. doi: 10.1152/ajplung.00080.2013. Epub 2013 May 10. Am J Physiol Lung Cell Mol Physiol. 2013. PMID: 23666750 Free PMC article.
-
Resistin deficiency in mice has no effect on pulmonary responses induced by acute ozone exposure.Am J Physiol Lung Cell Mol Physiol. 2015 Nov 15;309(10):L1174-85. doi: 10.1152/ajplung.00270.2015. Epub 2015 Sep 18. Am J Physiol Lung Cell Mol Physiol. 2015. PMID: 26386120 Free PMC article.
-
Chemokine-like receptor 1 (CMKLR1) and chemokine (C-C motif) receptor-like 2 (CCRL2); two multifunctional receptors with unusual properties.Exp Cell Res. 2011 Mar 10;317(5):674-84. doi: 10.1016/j.yexcr.2010.10.023. Epub 2010 Nov 4. Exp Cell Res. 2011. PMID: 21056554 Free PMC article. Review.
-
Molecular Basis for CCRL2 Regulation of Leukocyte Migration.Front Cell Dev Biol. 2020 Dec 10;8:615031. doi: 10.3389/fcell.2020.615031. eCollection 2020. Front Cell Dev Biol. 2020. PMID: 33363177 Free PMC article. Review.
Cited by
-
The Dual Role of Chemerin in Lung Diseases.Cells. 2024 Jan 16;13(2):171. doi: 10.3390/cells13020171. Cells. 2024. PMID: 38247862 Free PMC article. Review.
-
Studies with neutralizing antibodies suggest CXCL8-mediated neutrophil activation is independent of C-C motif chemokine receptor-like 2 (CCRL2) ligand binding function.PLoS One. 2023 Jan 20;18(1):e0280590. doi: 10.1371/journal.pone.0280590. eCollection 2023. PLoS One. 2023. PMID: 36662882 Free PMC article.
-
Sex Differences in Energy Metabolism: A Female-Oriented Discussion.Sports Med. 2024 Aug;54(8):2033-2057. doi: 10.1007/s40279-024-02063-8. Epub 2024 Jun 18. Sports Med. 2024. PMID: 38888855 Review.
-
Interleukin-11 receptor subunit α-1 is required for maximal airway responsiveness to methacholine after acute exposure to ozone.Am J Physiol Regul Integr Comp Physiol. 2022 Dec 1;323(6):R921-R934. doi: 10.1152/ajpregu.00213.2022. Epub 2022 Oct 25. Am J Physiol Regul Integr Comp Physiol. 2022. PMID: 36283092 Free PMC article.
-
Inconsequential role for chemerin-like receptor 1 in the manifestation of ozone-induced lung pathophysiology in male mice.Physiol Rep. 2024 Apr;12(8):e16008. doi: 10.14814/phy2.16008. Physiol Rep. 2024. PMID: 38631890 Free PMC article.
References
-
- Alpert, S. M. , Schwartz B. B., Lee S. D., and Lewis T. R.. 1971. Alveolar protein accumulation. A sensitive indicator of low level oxidant toxicity. Arch. Intern. Med. 128:69–73. - PubMed
-
- Bachelerie, F. , Ben‐Baruch A., Burkhardt A. M., Combadiere C., Farber J. M., Graham G. J., et al. 2014. International Union of Basic and Clinical Pharmacology. [corrected]. LIX. Update on the extended family of chemokine receptors and introducing a new nomenclature for atypical chemokine receptors. Pharmacol. Rev. 66:1–79. - PMC - PubMed
-
- Barreno, R. X. , Richards J. B., Schneider D. J., Cromar K. R., Nadas A. J., Hernandez C. B., et al. 2013. Endogenous osteopontin promotes ozone‐induced neutrophil recruitment to the lungs and airway hyperresponsiveness to methacholine. Am. J. Physiol. Lung Cell. Mol. Physiol. 305:L118–L129. - PMC - PubMed
-
- Bassett, D. , Elbon‐Copp C., Otterbein S., Barraclough‐Mitchell H., Delorme M., and Yang H.. 2001. Inflammatory cell availability affects ozone‐induced lung damage. J. Toxicol. Environ. Health A 64:547–565. - PubMed
MeSH terms
Substances
Grants and funding
LinkOut - more resources
Full Text Sources
Other Literature Sources
Medical
Molecular Biology Databases
Research Materials
