

Subspecies in the global human gut microbiome
- PMID: 29242367
- PMCID: PMC5740502
- DOI: 10.15252/msb.20177589
Subspecies in the global human gut microbiome
Abstract
Population genomics of prokaryotes has been studied in depth in only a small number of primarily pathogenic bacteria, as genome sequences of isolates of diverse origin are lacking for most species. Here, we conducted a large-scale survey of population structure in prevalent human gut microbial species, sampled from their natural environment, with a culture-independent metagenomic approach. We examined the variation landscape of 71 species in 2,144 human fecal metagenomes and found that in 44 of these, accounting for 72% of the total assigned microbial abundance, single-nucleotide variation clearly indicates the existence of sub-populations (here termed subspecies). A single subspecies (per species) usually dominates within each host, as expected from ecological theory. At the global scale, geographic distributions of subspecies differ between phyla, with Firmicutes subspecies being significantly more geographically restricted. To investigate the functional significance of the delineated subspecies, we identified genes that consistently distinguish them in a manner that is independent of reference genomes. We further associated these subspecies-specific genes with properties of the microbial community and the host. For example, two of the three Eubacterium rectale subspecies consistently harbor an accessory pro-inflammatory flagellum operon that is associated with lower gut community diversity, higher host BMI, and higher blood fasting insulin levels. Using an additional 676 human oral samples, we further demonstrate the existence of niche specialized subspecies in the different parts of the oral cavity. Taken together, we provide evidence for subspecies in the majority of abundant gut prokaryotes, leading to a better functional and ecological understanding of the human gut microbiome in conjunction with its host.
Keywords: genetic variation; metagenomics; microbiome; population structure; prokaryotic subspecies.
© 2017 European Molecular Biology Laboratory. Published under the terms of the CC BY 4.0 license.
Figures
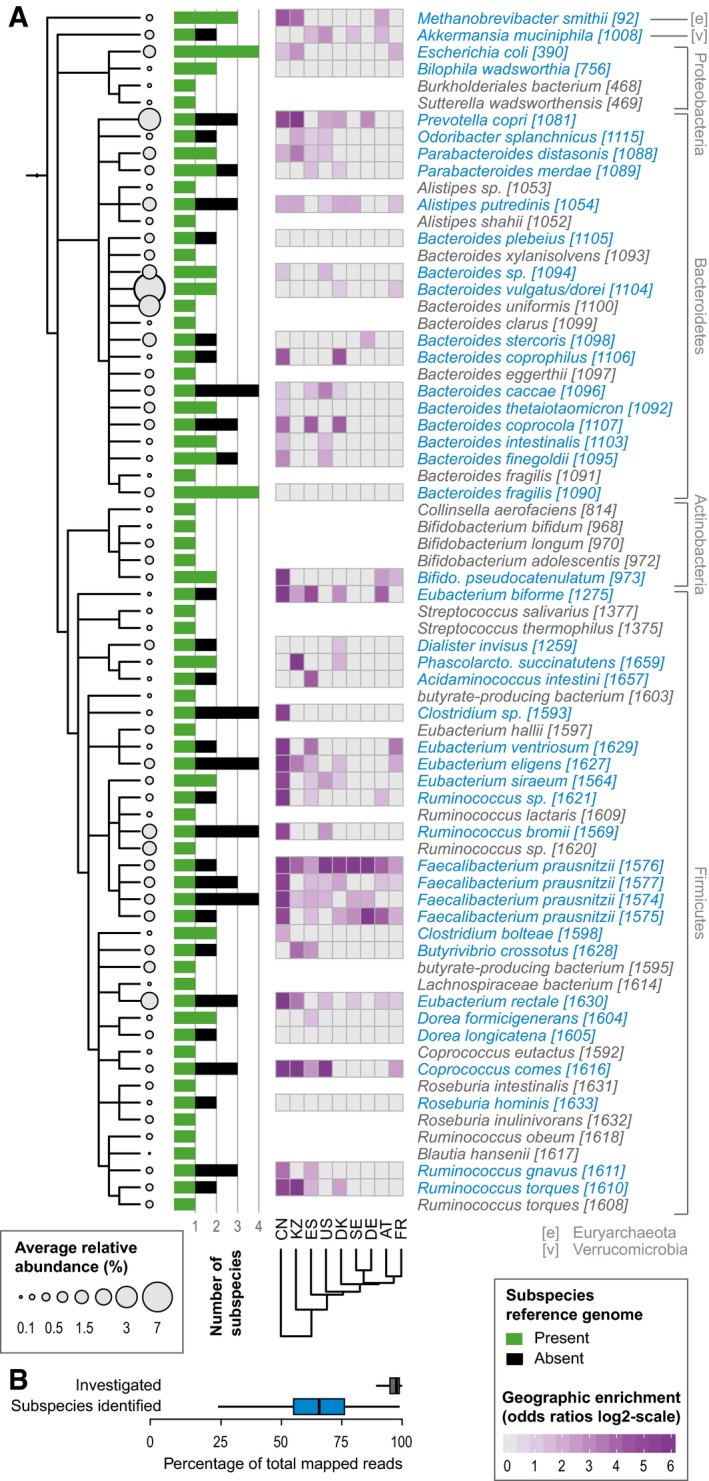
- A, B
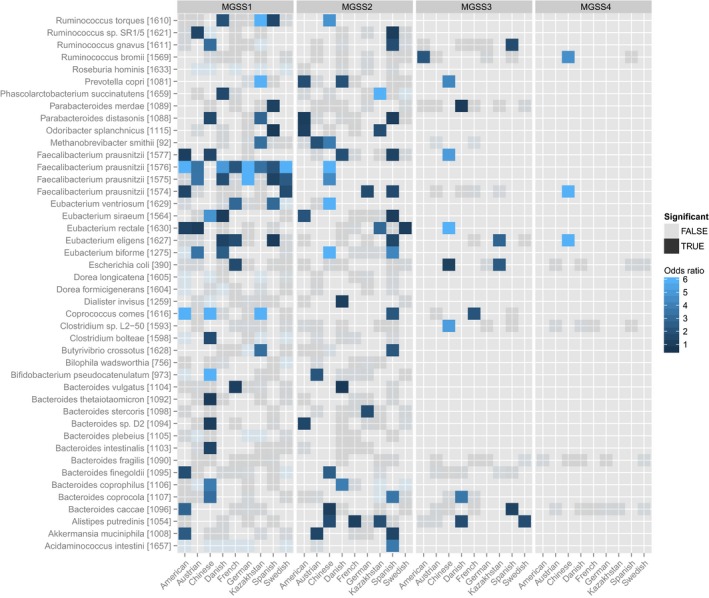
Human gut microbial species explored for the existence of subspecies show wide phylogenetic spread according to NCBI taxonomy (A) and include Methanobrevibacter smithii, the main archaeal member of the human gut microbiome, as well as representatives of all abundant phyla. Species names are according to NCBI taxonomy, with species cluster (specI) identifiers according to Mende et al (2013), which splits some named species into multiple specI clusters. Of 71 investigated species, 44 stratify into subspecies (highlighted in blue). Each species' average abundance across 2,144 human gut metagenomes is proportional to the size of the circles on the cladogram. Bars represent the number of subspecies identified in each, with “1” indicating no subdivision. The black portion of the bar corresponds to subspecies for which no representative genome sequence is available from NCBI. Geographic enrichments of subspecies are displayed as a heat map (showing only significant enrichment, FDR‐corrected Fisher test P‐value < 0.05, per country as maximum log‐odds ratio across conspecific subspecies). Subspecies with a restricted geographic range are predominantly found in the Chinese and Kazakh populations. The 71 investigated species captured an average of 95.5% of sequencing reads that were assigned to any reference genome. The subset of 44 species with identified subspecies accounted for the majority of this abundance (B).
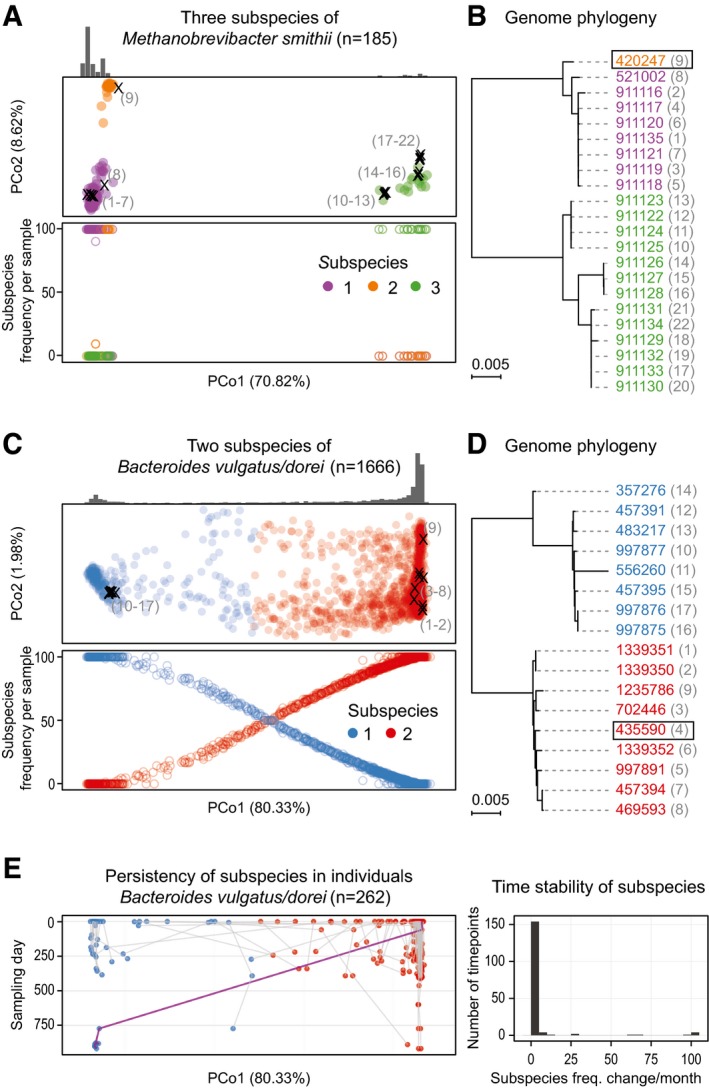
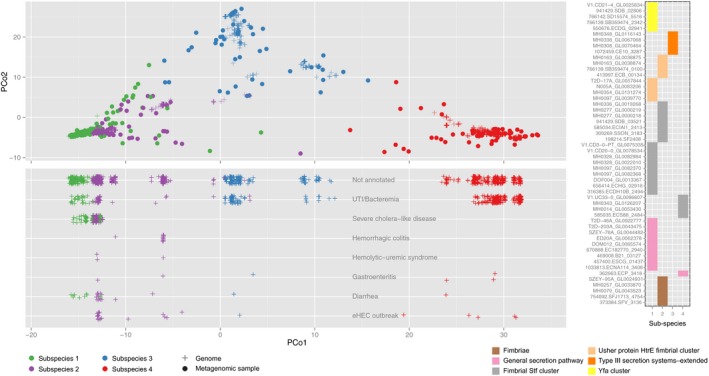
- A–D
Subspecies identified for Methanobrevibacter smithii and Bacteroides vulgatus/dorei are shown in principal coordinate (PCoA) projections of the between‐sample distances based on single‐nucleotide variations (see Materials and Methods). The first principal coordinate (PC) explains over 70% of the variation in both cases (panels A and C). Reference genomes have been projected into the same PCoA plots (marked with “×” in A and C; see Materials and Methods). The numbers adjacent to the placed genomes correspond to those shown in parentheses next to NCBI taxonomy identifiers (leaves) on the phylogenetic trees in (B, D), respectively. The sample density for each subspecies is highlighted by the histogram above, and the total number of samples in which the species could be quantified is indicated in headers. Quantification of the frequency of each subspecies (bottom plot in A and C) reveals that for M. smithii, only one sample has two subspecies co‐occurring in one individual, while all the others have a single dominating one. In contrast, for B. vulgatus/dorei, co‐occurrence is more commonly observed. Phylogenies reconstructed from the reference genomes (NCBI taxonomy identifiers; see Materials and Methods) are fully consistent with the SNP‐based clustering. The representative genome for each species, relative to which genomic variants were called, is highlighted with a box.
- E
In B. vulgatus/dorei, subspecies composition within each individual is generally stable over time, with a change of the dominant subspecies being rare even over a period of up to 1,000 days. An exception (highlighted by purple line) is seen for an individual, in which one dominant subspecies is replaced by another one after antibiotic treatment. The right‐hand panel summarizes subspecies frequency changes, underlining remarkable stability over time.
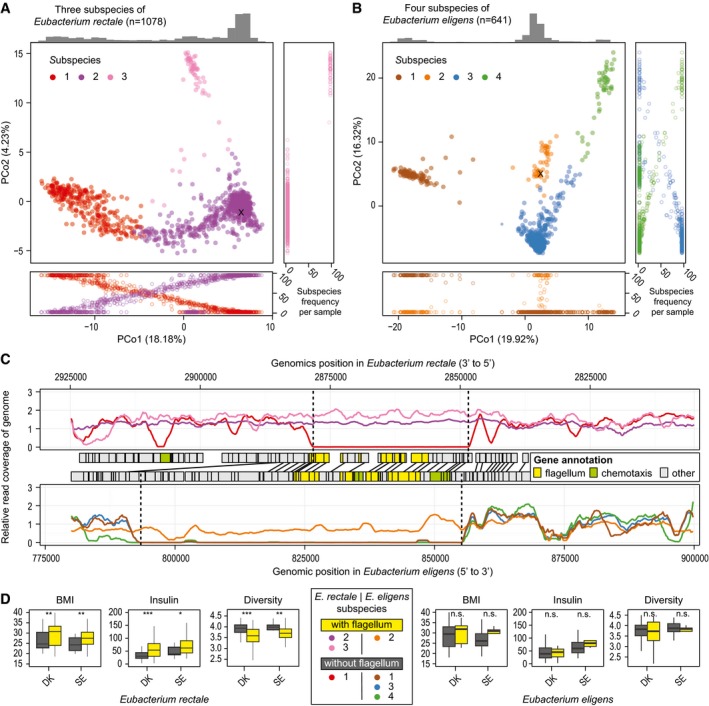
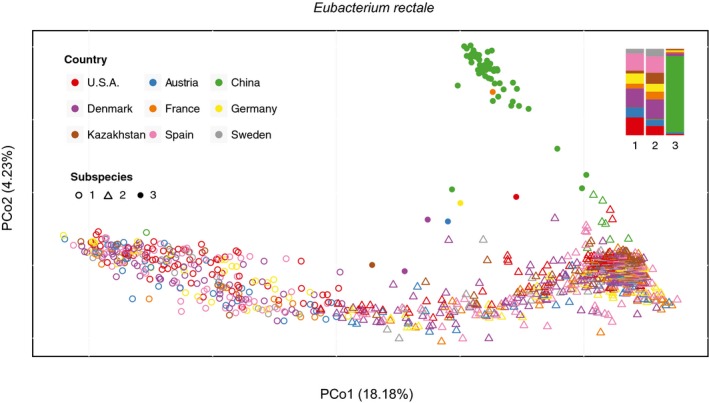
- A, B
Three subspecies of Eubacterium rectale (A) and four of Eubacterium eligens (B) are color‐coded in PCoA plots. In most individuals, we observe dominance of one subspecies at a time (see frequency plots alongside PCoAs).
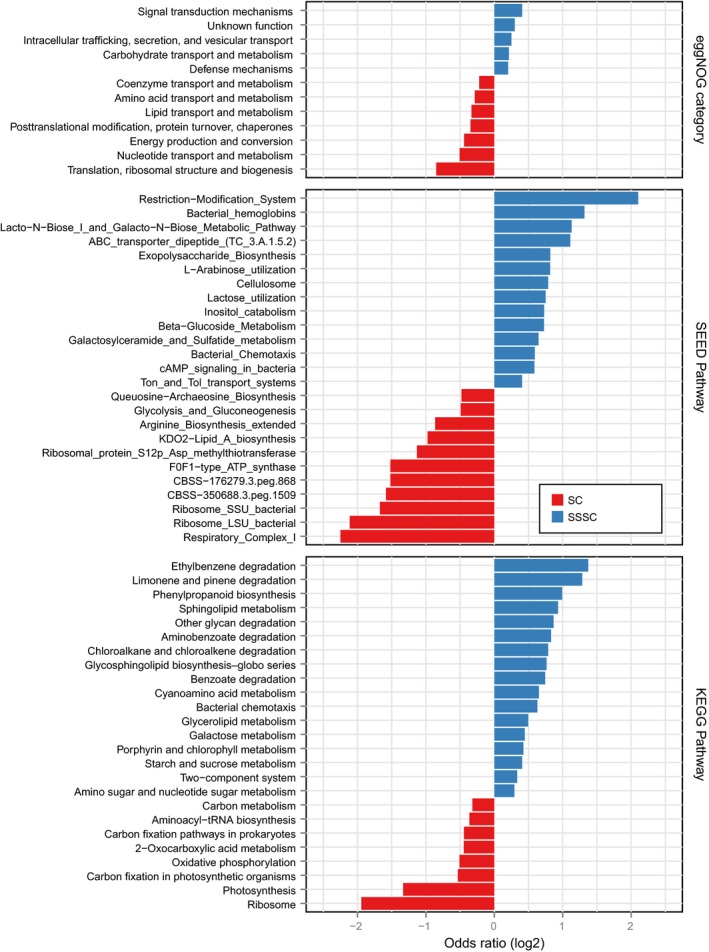
- C
Functionally, the main distinction between some of the subspecies is large deletions which harbor many flagellum and chemotaxis‐related genes (based on SEED as well as KEGG annotations), as evident from genomic read coverage (subspecies color‐coded as in A and B).
- D
Grouping E. rectale individuals from the Danish (DK) and Swedish (SE) studies, based on this deletion, shows a significant (*P < 0.05, **P < 0.01, ***P < 0.001) increase in BMI and blood fasting insulin levels as well as a decrease in overall community diversity in individuals who are predominantly colonized by the flagellum‐carrying subspecies (see Materials and Methods). The same trend is observed for E. eligens subspecies in the same studies, though not statistically significant (n.s.). In the boxplots, the median is given as horizontal line and boxes represent the 25th and 75th percentiles. Whiskers extend to the point closest to 1.5 times the interquartile range.
References
-
- Achtman M, Wagner M (2008) Microbial diversity and the genetic nature of microbial species. Nat Rev Microbiol 6: 431 - PubMed
-
- Bale J, Meunier D, Weill F‐X, dePinna E, Peters T, Nair S (2016) Characterization of new Salmonella serovars by whole‐genome sequencing and traditional typing techniques. J Med Microbiol 65: 1074–1078 - PubMed
-
- Biller SJ, Berube PM, Lindell D, Chisholm SW (2014) Prochlorococcus: the structure and function of collective diversity. Nat Rev Microbiol 13: 13–27 - PubMed
-
- Cohan FM (2001) Bacterial species and speciation. Syst Biol 50: 513–524 - PubMed
MeSH terms
LinkOut - more resources
Full Text Sources
Other Literature Sources
