

Changes in Excess Mortality from End Stage Renal Disease in the United States from 1995 to 2013
- PMID: 29242373
- PMCID: PMC5753309
- DOI: 10.2215/CJN.04330417
Changes in Excess Mortality from End Stage Renal Disease in the United States from 1995 to 2013
Abstract
Background and objectives: Individuals with ESRD have a very high risk of death. Although mortality rates have decreased over time in ESRD, it is unknown if improvements merely reflect parallel increases in general population survival. We, therefore, examined changes in the excess risk of all-cause mortality-over and above the risk in the general population-among people treated for ESRD in the United States from 1995 to 2013. We hypothesized that the magnitude of change in the excess risk of death would differ by age and RRT modality.
Design, setting, participants, & measurements: We used time-dependent relative survival models including data from persons with incident ESRD as recorded in the US Renal Data System and age-, sex-, race-, and calendar year-specific general population mortality rates from the Centers for Disease Control and Prevention. We calculated relative excess risks (analogous to hazard ratios) to examine the association between advancing calendar time and the primary outcome of all-cause mortality.
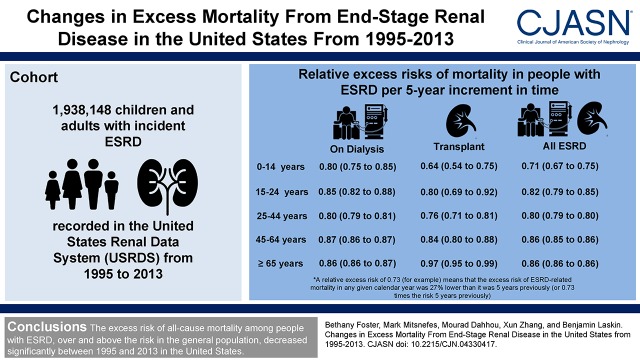
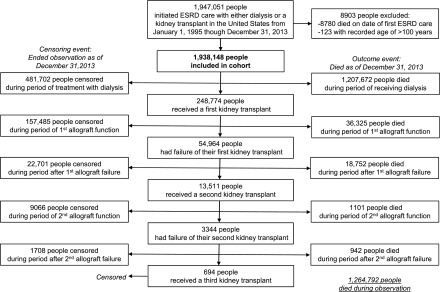
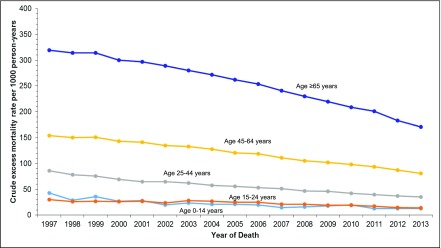
Results: We included 1,938,148 children and adults with incident ESRD from 1995 to 2013. Adjusted relative excess risk per 5-year increment in calendar time ranged from 0.73 (95% confidence interval, 0.69 to 0.77) for 0-14 year olds to 0.88 (95% confidence interval, 0.88 to 0.88) for ≥65 year olds, meaning that the excess risk of ESRD-related death decreased by 12%-27% over any 5-year interval between 1995 and 2013. Decreases in excess mortality over time were observed for all ages and both during treatment with dialysis and during time with a functioning kidney transplant (year by age and year by renal replacement modality interactions were both P<0.001), with the largest relative improvements observed for the youngest persons with a functioning kidney transplant. Absolute decreases in excess ESRD-related mortality were greatest for the oldest persons.
Conclusions: The excess risk of all-cause mortality among people with ESRD, over and above the risk in the general population, decreased significantly between 1995 and 2013 in the United States.
Keywords: Adult; Centers for Disease Control and Prevention (U.S.); Child; Confidence Intervals; Humans; Kidney Failure, Chronic; Renal Replacement Therapy; Risk; United States; kidney; kidney transplantation; renal dialysis.
Copyright © 2018 by the American Society of Nephrology.
Figures
Comment in
-
Life Expectancy Gains for Patients with ESRD.Clin J Am Soc Nephrol. 2018 Jan 6;13(1):11-12. doi: 10.2215/CJN.12831117. Epub 2017 Dec 14. Clin J Am Soc Nephrol. 2018. PMID: 29242372 Free PMC article. No abstract available.
References
-
- United States Renal Data System : USRDS 2014 Annual Data Report: Atlas Of Chronic Kidney Disease and End-Stage Renal Disease in the United States, Bethesda, MD, National Institutes of Health and National Institute of Diabetes and Digestive and Kidney Diseases, 2014
-
- McDonald SP, Craig JC; Australian and New Zealand Paediatric Nephrology Association : Long-term survival of children with end-stage renal disease. N Engl J Med 350: 2654–2662, 2004 - PubMed
-
- Meier-Kriesche HU, Ojo AO, Port FK, Arndorfer JA, Cibrik DM, Kaplan B: Survival improvement among patients with end-stage renal disease: Trends over time for transplant recipients and wait-listed patients. J Am Soc Nephrol 12: 1293–1296, 2001 - PubMed
Publication types
MeSH terms
Grants and funding
LinkOut - more resources
Full Text Sources
Other Literature Sources
Medical
