. 2017 Dec 14;8(1):2118.
doi: 10.1038/s41467-017-01805-9.

DNA damage causes rapid accumulation of phosphoinositides for ATR signaling

Affiliations

DNA damage causes rapid accumulation of phosphoinositides for ATR signaling

Yu-Hsiu Wang et al. Nat Commun. .

Abstract

Phosphoinositide lipids (PPIs) are enriched in the nucleus and are accumulated at DNA damage sites. Here, we investigate roles of nuclear PPIs in DNA damage response by sequestering specific PPIs with the expression of nuclear-targeted PH domains, which inhibits recruitment of Ataxia telangiectasia and Rad3-related protein (ATR) and reduces activation of Chk1. PPI-binding domains rapidly (< 1 s) accumulate at damage sites with local enrichment of PPIs. Accumulation of PIP3 in complex with the nuclear receptor protein, SF1, at damage sites requires phosphorylation by inositol polyphosphate multikinase (IPMK) and promotes nuclear actin assembly that is required for ATR recruitment. Suppressed ATR recruitment/activation is confirmed with latrunculin A and wortmannin treatment as well as IPMK or SF1 depletion. Other DNA repair pathways involving ATM and DNA-PKcs are unaffected by PPI sequestration. Together, these findings reveal that nuclear PPI metabolism mediates an early damage response through the IPMK-dependent pathway to specifically recruit ATR.


Conflict of interest statement

The authors declare no competing financial interests.

Figures

Fig. 1
Fig. 1
Nuclear PIP2/PIP3 level increases upon DNA damage induction. a Confocal optical slices showing nuclear PIP2 speckles and γH2AX foci in control U2OS cells as revealed by immunostaining before and after being exposed to UV. Secondary antibody labeling PIP2 and γH2AX was conjugated with Alexa Fluor-546 and Alexa Fluor-647, respectively. b Corresponding quantification of panel A showing the normalized mean fluorescence intensity of Hoechst 33342, PIP2 and γH2AX within the nucleus. c Same anti-PIP2 and anti-γH2AX staining for U2OS cells transfected with 3xNLS-PLCδPH before and after being exposed to UV. d Corresponding quantification of panel c. Results were normalized to the signal intensities of non-UV treated, non-transfected cells as shown in panel B. Symbols in black indicated t-test p-values when comparing it to the signal intensity of non-UV treated, non-transfected cells in panel b. Symbols in blue indicated t-test results when comparing it to the non-UV treated PLCδPH-expressing cells. Please refer to Supplementary Figure 1 for similar results obtained from cells with chemical-induced DNA damage. e Western blots showing suppressed Chk1 activation and increased γH2AX level in MEFs expressing 3xNLS-PLCδPH-EGFP, but not EGFP or cytoplasmic PLCδPH-EGFP upon global UV irradiation. Numbers on the left indicated the molecular weight of the ladder. Cells were exposed to UV for 2 min and harvested after 1hr recovery in an incubator. f Corresponding pChk1 ratio with and without being exposed to UV. Scale bar 10 μm. Data are representative of three independent experiments. Error bars represent mean ± s.e.m in all panels. Student’s t-test, *p < 0.05; **p < 0.01; ***p < 0.001; ****p < 0.0001. n.s. represents not significant
Fig. 2
Fig. 2
Sequestering nuclear phosphoinositides suppresses ATR as well as ATRIP and ATR-mediated pChk1 recruitment. a Illustration of protein probes used for sequestering specific nuclear PPIs. b Confocal montage of ATR recruitment upon laser microirradiation with or without the expression of individual cytosolic or NLS-tagged PPI-binding domains or their loss-of-function mutants. c Quantification of ATR recruitment within the ROI with the expression of cytosolic PLCδ-PH. d-f Quantification of ATR recruitment within the ROI with or without the expression of SidM-P4M, PLCδ-PH and Btk-PH domain, respectively, or their corresponding mutants. g Representative micrographs of control and PLCδ-PH-expressing cells stained with ATR and γH2AX after laser microirradiation and h the corresponding quantification of fluorescence signals within the ROI. i, j Representative micrographs of similar experiments stained for ATRIP and its corresponding quantification. k, l Another similar experiment stained for pChk1-S345 and its corresponding quantification. Dashed circles are 2.5 μm in diameter indicating the ROI for laser microirradiation. Data are representative of three independent experiments. Error bars represent mean ± s.e.m. Student’s t-test, ***p < 0.001; ****p < 0.0001. n.s. represents not significant
Fig. 3
Fig. 3
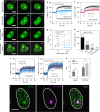
Active and rapid accumulation of PH domains upon laser microirradiation is wortmannin-sensitive. Confocal montage of cells after laser microirradiation while expressing a 3xNLS-PLCδPH-EGFP, b 3xNLS-EGFP, c 3xNLS-PLCδPH Mutant (K30L/K32L/R40L) or d 3xNLS-PLCδPH-EGFP after cell was killed by addition of 100 mM MEA. e Corresponding quantification of the mean fluorescence intensity within ROIs for panels A, B and D. Shaded area represents standard deviation. f Quantification of the mean fluorescence intensity within ROIs for panels A and C. Shaded area represents standard deviation. g Laser power-dependent measurement of protein accumulation magnitude within ROIs under control, ATP-depleted condition or at a lower temperature. h Pooled and normalized magnitude of PLCδ-PH accumulation under different conditions after background subtraction as determined by EGFP-3xNLS. i, j The accumulation magnitude of Btk-PH and PLCδ-PH domain, respectively, in the presence or absence of 0.5 μM wortmannin. Blue dotted line indicates the background level determined by EGFP-3xNLS. Error bars represent mean ± s.d. k The corresponding quantification of panels i, j with background subtraction. l Representative immunofluorescent micrographs of cells stained for PIP2 and γH2AX after laser microirradiation. Laser power for damage induction was set as constant at 1 nW for 500 ms except for panel g, h. Scale bars are 10 μm for all panels. Dashed circles indicate the ROI for laser microirradiation. Data are representative of three independent experiments. All error bars represent mean ± s.e.m. except panel i, j. Student’s t-test, *p < 0.05; ***p < 0.001; ****p < 0.0001. n.s. represents not significant. BKG represents background level
Fig. 4
Fig. 4
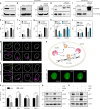
IPMK and SF1 depletion suppresses PH domain accumulation and IPMK is required for ATR recruitment. ad Western blots showing effective knock-down or knock-out with or without rescue of selected phosphoinositide kinases: PIP5K1A (siRNA), PIP5K1B (shRNA), PIK3CB (CRISPR-Cas9) and IPMK (siRNA) together with eh the quantified accumulation magnitude of Btk-PH and PLCδ-PH after background subtraction in designated protein depleted backgrounds (n ≥ 15 for all cases). In panel d&h, the cells were rescued with either siRNA-resistant and flag-tagged wild type human IPMK (siRes2-3xFlag-hIPMK-WT) or its kinase dead mutant (siRes2-3xFlag-hIPMK-D144N). Numbers labeled next to the blots indicated the molecular weight of the ladder. i Western blot showing the effective depletion and rescue of SF1 by shRNA and an shRNA-resistant Myc-DDK-tagged mouse SF1 construct (shResA-mSF1-WT-Myc-DDK). The overpression of SF1 rescue gave two separate bands, likely with and without the Myc-DDK tag. j The quantified accumulation magnitude of Btk-PH and PLCδ-PH with background subtraction in SF1 depleted and rescued conditions. k Schematic depicting the SF1-PIP2 complex as a substrate of IPMK but not classical PI3K while both kinases phosphorylate PIP2 in vitro. l Confocal montage of transiently expressed SF1-EGFP upon laser microirradiation. m, n ATR and γH2AX immunofluorescence micrographs of U2OS nucleus upon laser microirradiation over time for control and IPMK-depleted conditions, respectively. o Normalized quantification comparing the magnitude of recruitment of ATR (n = 20), ATM (n = 13), DNA-PKcs (n = 14) and γH2AX (n = 47) within ROIs in control and IPMK-depleted conditions. Please refer to Supplementary Fig. 4 for the representative images of ATM and DNA-PKcs staining. p Transient depletion of IPMK in U2OS cells and the q transient depletion of SF1 in MEF cells both demonstrated a suppressed phosphorylation of Chk1 upon global UV irradiation. Data are representative of three independent experiments. in all panels. Dashed circles indicate the ROI for laser microirradiation. Error bars represent mean ± s.e.m in all panels. Student’s t-test, **p < 0.01; ***p < 0.001. n.s. represents not significant. Scale bars are 10 μm for all panels
Fig. 5
Fig. 5
Recruitment of ATR but not ATM or DNA-PKcs depends on filamentous actin assembly. Confocal montage together with the bright field images of cells stably expressing GFP-ATR showing the recruitment of ATR to damage sites a control conditions, b 10 μM Lat A and c 2 μM wortmannin. d GFP-ATR recruitment at damage sites was suppressed by Lat A in a dose-dependent manner. e Corresponding quantification of accumulation magnitude of GFP-ATR at 270 s after microirradiation dropped with increasing Lat A concentration from 0.8 to 20 μM. f The recruitment of GFP-ATR was also inhibited by wortmannin in a dose-dependent manner. g Corresponding accumulation magnitude of GFP-ATR at 270 s after microirradiation dropped with increasing wortmannin concentration from 0.5 to 2 μM. Representative immunofluorescent micrographs stained for h ATR/γH2AX and i DNA-PKcs/γH2AX after microirradiation in the presence or absence of 0.8 μM Lat A. j Corresponding normalized quantification of panel h&i and the staining for ATM (image not shown) (n = 13 for ATR; n = 15 for both ATM and DNA-PK; n = 43 for γH2AX staining). k Pre-treatment of Lat A at 10 μM for 30 min significantly suppressed the activation of Chk1 by ATR upon global UV irradiation. Error bars represent mean ± s.e.m. in all panels. Dashed circles indicate the ROI for laser microirradiation. Scale bars are 10 μm for all panels. Data are representative of three independent experiments. Student’s t-test, **p < 0.01; ***p < 0.001; ****p < 0.0001. n.s. represents not significant
Fig. 6
Fig. 6
Nuclear actin assembly follows the accumulation of PH domains and formins at damage sites and is inhibited by Lat A. a Confocal micrographs of U2OS cells expressing NLS-tagged Utr230-EGFP before and after laser microirradiation with or without 0.8 μM Lat A or after the co-expression of 3xNLS-PLCδ-PH-mCherry. Dashed circles indicate the ROI for laser microirradiation b Corresponding quantification of mean  fluorescence intensity of Utr230 within the ROI in the absence or presence of Lat A, or the co-expression of PLCδ-PH in the nucleus. c The recruiting dynamics of NLS-tagged PLCδ-PH, mDia2 and Utr230 upon laser microirradiation in independent measurements. d Complementary FRAP measurements of the same three NLS-tagged proteins showed that all three proteins are equally diffusive in the nucleus. e Summarized half times for damage-induced accumulation and photobleaching recovery times of NLS-tagged PLCδ-PH, mDia2 and Utr230. Data are representative of three independent experiments for panel A&B and at least two independent experiments for panel C-E. Error bars represent mean ± s.e.m. in all panels. Student’s t-test, *p < 0.05; **p < 0.01; ***p < 0.001. n.s. represents not significant. BKG represents background level
Fig. 7
Fig. 7
Schematic illustration of proposed model for PPI- and nuclear actin-dependent ATR-ATRIP-pChk1 signaling axis. a Proteins that are recruited to the damage site along the time line are grouped into two categories by whether or not their recruitment or activation depends upon nuclear PPIs. b Schematic presentation of proposed model for PPIs- and actin-dependent recruitment and activation of ATR-ATRIP complex

Similar articles

Cited by

References

    1. Dieck CB, Wood A, Brglez I, Rojas-Pierce M, Boss WF. Increasing phosphatidylinositol (4,5) bisphosphate biosynthesis affects plant nuclear lipids and nuclear functions. Plant physiology and biochemistry: PPB / Societe francaise de physiologie vegetale. 2012;57:32–44. doi: 10.1016/j.plaphy.2012.05.011. - DOI - PMC - PubMed
    1. Garnier-Lhomme M, et al. Nuclear envelope remnants: fluid membranes enriched in sterols and polyphosphoinositides. PLoS. ONE. 2009;4:e4255. doi: 10.1371/journal.pone.0004255. - DOI - PMC - PubMed
    1. Dieck CB, Boss WF, Perera IY. A role for phosphoinositides in regulating plant nuclear functions. Frontiers in plant science. 2012;3:50. doi: 10.3389/fpls.2012.00050. - DOI - PMC - PubMed
    1. Kleinig H. Nuclear membranes from mammalian liver: II. Lipid composition. J. Cell. Biol. 1970;46:396–402. doi: 10.1083/jcb.46.2.396. - DOI - PMC - PubMed
    1. Smith CD, Wells WW. Phosphorylation of rat liver nuclear envelopes. II. Characterization of in vitro lipid phosphorylation. J. Biol. Chem. 1983;258:9368–9373. - PubMed

Publication types

MeSH terms

Substances