. 2018 Jan;19(1):29-40.
doi: 10.1038/s41590-017-0002-1. Epub 2017 Nov 21.

Atad3a suppresses Pink1-dependent mitophagy to maintain homeostasis of hematopoietic progenitor cells

Affiliations

Atad3a suppresses Pink1-dependent mitophagy to maintain homeostasis of hematopoietic progenitor cells

Guoxiang Jin et al. Nat Immunol. 2018 Jan.

Abstract

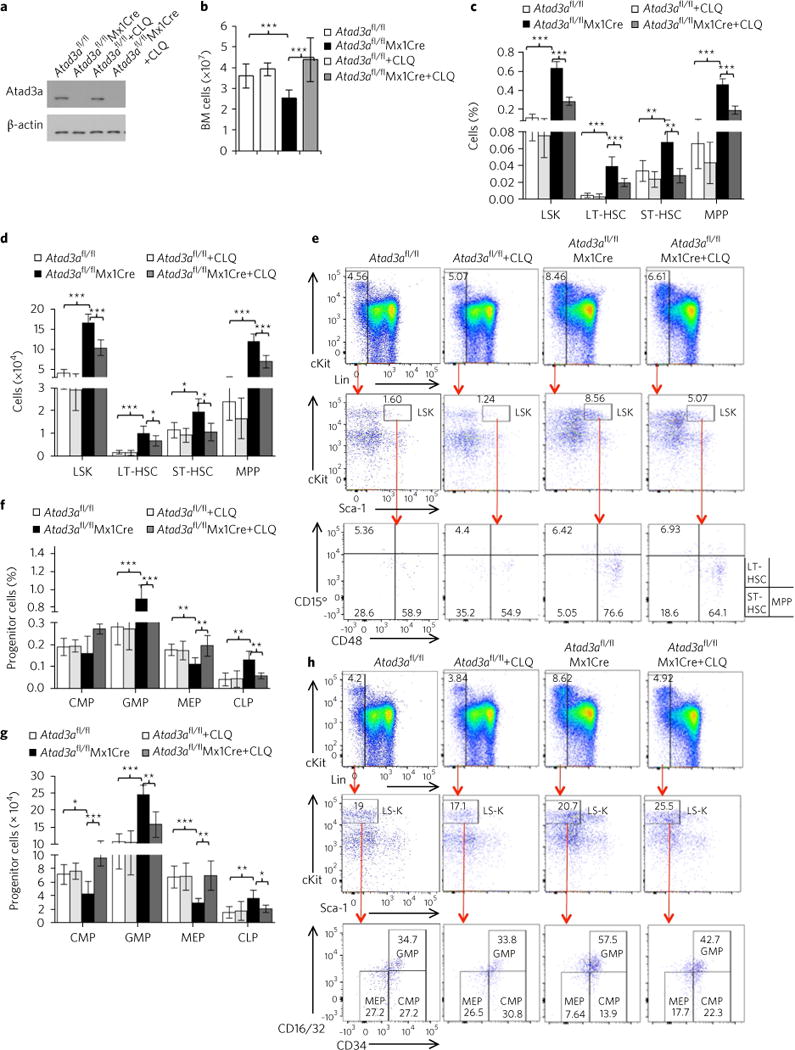
Although deletion of certain autophagy-related genes has been associated with defects in hematopoiesis, it remains unclear whether hyperactivated mitophagy affects the maintenance and differentiation of hematopoietic stem cells (HSCs) and committed progenitor cells. Here we report that targeted deletion of the gene encoding the AAA+-ATPase Atad3a hyperactivated mitophagy in mouse hematopoietic cells. Affected mice showed reduced survival, severely decreased bone-marrow cellularity, erythroid anemia and B cell lymphopenia. Those phenotypes were associated with skewed differentiation of stem and progenitor cells and an enlarged HSC pool. Mechanistically, Atad3a interacted with the mitochondrial channel components Tom40 and Tim23 and served as a bridging factor to facilitate appropriate transportation and processing of the mitophagy protein Pink1. Loss of Atad3a caused accumulation of Pink1 and activated mitophagy. Notably, deletion of Pink1 in Atad3a-deficient mice significantly 'rescued' the mitophagy defect, which resulted in restoration of the progenitor and HSC pools. Our data indicate that Atad3a suppresses Pink1-dependent mitophagy and thereby serves a key role in hematopoietic homeostasis.


Conflict of interest statement

Competing interests

The authors declare no competing financial interests.

Figures

Fig. 1
Fig. 1. Deletion of Atad3a skews hematopoietic differentiation
a, Expression of Atad3a mRNA in various hematopoietic populations (horizontal axis); results are presented relative to those of LT-HSCs. b, Survival of Atad3afl/fl and Atad3afl/flMx1Cre mice (key) after injection of poly(I:C) (Kaplan-Meier analysis). c–e, Total cells in the bone marrow (c), spleen (d) and thymus (e) of Atad3afl/fl and Atad3afl/flMx1Cre mice (key). f, Quantification of white blood cells (WBC), lymphocytes, red blood cells (RBC), platelets (PLT) and hemoglobin in the peripheral blood of Atad3afl/fl and Atad3afl/flMx1Cre mice (key). g, Frequency of various cells (horizontal axis) of the bone-marrow (BM) lineage in Atad3afl/fl and Atad3afl/flMx1Cre mice (key). *P< 0.05, **P<0.01 and ***P<0.001, LT-HSC versus Lin+ in a (one-way analysis of variance (ANOVA) followed by Bonferroni post-hoc test (a), log-rank (Mantel Cox) test (b) or Student's t-test (c–g)). Data are representative of two independent experiments (a; mean ± s.d. of n = 3 biological replicates) or three independent experiments with n = 10 mice per group (b) or are from two independent experiments (c–e,g (average); mean± s.d. of n = 8 mice per genotype (c–e), or n = 6 mice per genotype (g) or n ≥ 3 mice per genotype (f)).
Fig. 2
Fig. 2. Atad3a is an intrinsic regulator of hematopoiesis
a, Survival (Kaplan-Meier analysis) of mice given transplantation of Atad3afl/fl or Atad3afl/flMx1Cre bone marrow (key). b, Frequency of donor-derived CD45.2+ cells (far left) and various cells (horizontal axis) of the bone-marrow lineage in mice given non-competitive transplantation of Atad3afl/fl or Atad3afl/flMx1Cre bone marrow (key), assessed by flow cytometry on day 10 after injection of poly(I:C) into the recipient mice. c–e, Frequency of donor-derived CD45.2+ cells (c), CD45.2+Mac1+ myeloid cells (d) or CD45.2+B220+ B cells (e) in the peripheral blood of mice given competitive transplantation of Atad3afl/fl or Atad3afl/flMx1Cre bone marrow (key), assessed by flow cytometry at various times (horizontal axis) after injection of poly(I:C) into the recipient mice (downward arrow). f, Frequency of various donor-derived cells (horizontal axis) in the bone marrow of mice given competitive transplantation of Atad3afl/fl or Atad3afl/flMx1Cre bone marrow (key), assessed 12 weeks after injection of poly(I:C) into the recipient mice. *P< 0.05 and ***P<0.001 (logrank (Mantel Cox) test (a) or Student’s t-test (b–f)). Data are from one experiment representative of two independent experiments (with n = 10 mice per group (a); mean ± s.d. of n>4 mice per group (b–f)).
Fig. 3
Fig. 3. Loss of Atad3a causes defective hematopoiesis at multiple stages
a,b, Frequency (a) and number (b) of LSK cells, LT-HSCs, ST-HSCs and MPPs (horizontal axis) in Atad3afl/fl or Atad3afl/flMx1Cre bone marrow (key). c, Flow cytometry of LSK cells, LT-HSCs, ST-HSCs and MPPs in Atad3afl/fl and Atad3afl/flMx1Cre bone marrow (above plots). Numbers in or adjacent to outlined areas indicate percent cells in each gate (key, bottom right). d,e, Frequency (d) and number (e) of CMPs, MEPs, GMPs and CLPs (horizontal axis) in Atad3afl/fl or Atad3afl/flMx1Cre bone marrow (key). f, Flow cytometry of CMPs, MEPs and GMPs in Atad3afl/fl or Atad3afl/flMx1Cre bone marrow (above plots). Numbers in or adjacent to outlined areas indicate percent cells in each gate (LSK: LinSca-1cKit+). g, Frequency of erythroid cells at various stages, including Ter119medCD71hi proerythroblasts (I), Ter119hiCD71hi basophilic erythroblasts (II), Ter119hiCD71med late erythroblasts (III) and Ter119hiCD71l° late erythroblasts (IV) (horizontal axis), in Atad3afl/fl or Atad3afl/flMx1Cre mice (key). h, Frequency of B lymphocytes at various stages, including B220+CD19CD24CD43+IgM pre-pro-B cells, B220+CD19+CD24+CD43+IgM pro-B cells, B220+CD19+CD24+CD43IgM pre-B cells and B220+CD19+CD24+CD43IgM+ immature B cells (horizontal axis), in Atad3afl/fl or Atad3afl/flMx1Cre mice (key). *P<0.05, **P< 0.01 and ***P<0.001 (Student’s t-test). Data are from two independent experiments (averaged; mean±s.d. of n = 8 mice per genotype (a,b,h), n = 6 mice per genotype (d,e) or n = 3 mice per genotype (g)).
Fig. 4
Fig. 4. Loss of Atad3a diminishes mitochondrial content and enhances mitophagy
a,b, Mitochondrial mass (a) and membrane potential (b) of various hematopoietic cell populations (horizontal axis) from Atad3afl/fl or Atad3afl/flMx1Cre mice (key); mass assessed with the green fluorescent mitochondrial stain MitoTracker Green FM (a), and membrane potential (assessed with TMRM, a red-orange fluorescent dye sequestered by active mitochondria), calculated as a ratio to mitochondria mass (TMRM/MitoTracker Green FM) (b), with both presented relative to results obtained for Atad3afl/fl mice. c, Oxygen-consumption rate (OCR) of LSK cells obtained from Atad3afl/fl or Atad3afl/flMx1Cre mice (key) and then treated sequentially (vertical lines) with 1 μM oligomycin (A), 0.5 μM FCCP (B) and 0.5 μM rotenone and antimycin (C); results presented per 1 × 10⁵ sorted LSK cells. d, Transmission electron microscopy of LSK cells from Atad3afl/fl or Atad3afl/flMx1Cre mice (above images); arrows indicate normal mitochondria (red) and mitophagy (yellow). Scale bars, 500 nm (top row) or 100 nm (bottom row). e, Mitochondrial mass of Atad3afl/fl or Atad3afl/flMx1Cre (key) hematopoietic cell populations (horizontal axis) in the presence (+ CLQ) or absence of chloroquine (key), presented as in a. f, Ratio of mitochondrial DNA (Nd4) to nuclear DNA (B2m) (mtDNA/nDNA) in purified Atad3afl/fl or Atad3afl/flMx1Cre (key) hematopoietic cell populations (horizontal axis) in the presence or absence of chloroquine (key), presented relative to results obtained for Atad3afl/fl mice. *P<0.05, ** P<0.01 and *** P<0.001 (Student’s t-test (ac) or one-way ANOVA followed by Bonferroni post-hoc test (e,f)). Data are from one experiment representative of three independent experiments (a,b; mean ± s.d. of n≥4 mice per genotype) or one experiment representative of two independent experiments (cf; mean ± s.d. of n = 3 mice per genotype (c), n = 4 mice per group (e) or n = 3 mice per group (f)).
Fig. 5
Fig. 5. Atad3a deficiency induces mitophagy of both healthy mitochondria and damaged mitochondria
a, Flow cytometry to distinguish populations with high membrane potential (healthy mitochondria) from those with low potential (damaged mitochondria) among hematopoietic cell populations (above plots) from Atad3afl/fl or Atad3afl/flMx1Cre mice (left margin). b,c, Mass of healthy mitochondria (b) and damaged mitochondria (c) in hematopoietic cell populations (horizontal axis) from Atad3afl/fl or Atad3afl/flMx1Cre mice (key), presented relative to results obtained for Atad3afl/fl mice. d, Confocal microscopy of the co-localization Tom20 and Lamp2a in HEK293T cells expressing (left margin) control (non-targeting) shRNA (shControl) or Atad3a-specific shRNA (shAtad3a) and treated with leupeptin (bottom two rows) or not (top two rows). Scale bar, 20 μm. e, Frequency of co-localized Tom20 and Lamp2a in cells as in d. *P<0.05, **P<0.01 and ***P<0.001 (Student’s t-test). Data are from one experiment representative of two independent experiments (mean±s.d. of n = 4 mice per group (b,c) or n ≥ 10 images per group (e)).
Fig. 6
Fig. 6. Atad3a promotes the import of Pink1 into mitochondria to prevent mitophagy
a, Immunoblot analysis of various proteins (left margin) in the mitochondrial fraction of sorted Atad3afl/fl or Atad3afl/flMx1Cre Lin cells in the presence (+ CLQ) or absence of chloroquine (top group) and in whole-cell lysates (WCL) (left half) and mitochondrial fractions (right half) of cells as above (bottom); numbers below lanes indicate densitometry analysis of band intensity, relative to that of either the control protein Hsp60 (top group) or LC3I or TOM40 (bottom group). b, Mitochondrial mass (left) of HEK293T cells expressing (horizontal axis) control shRNA (shControl) or shRNA specific for Atad3a (shAtad3a) or both Atad3a and Pink1 (shAtad3a + shPink1), and immunoblot analysis (right) of Atad3a, Pink1 and β-actin (loading control) (left margin) in cells as at left; mass results (left) are presented relative to those obtained with control shRNA. c, Immunoblot analysis of various proteins (left margin) in the mitochondrial fractions of HEK293T cells treated as in b; numbers below, as in a. d, Immunoblot analysis of Tim23, Tom40 and Atad3a (arrow (right margin)) in HEK293T cells treated for 1 h with 10 μM oligomycin and 4 μM antimycin (OA) or not (0) (above lanes), assessed after immunoprecipitation (IP) with immunoglobulin G (IgG), as a control, or with antibody to Atad3a (above blots); numbers below, densitometry, relative to that of Atad3a; bottom (Input), immunoblot analysis of cells as above, without immunoprecipitation. e, Immunoblot analysis of Atad3a and Pink1 in HEK293T cells expressing (above lanes) control shRNA or either of two shRNAs (−1, −2) specific for Tomm40 (shTom40), assessed after immunoprecipitation with IgG or antibody to Pink1 (above blots); numbers below, densitometry, relative to that of Pink1; bottom (Input), immunoblot analysis of Atad3a, Pink1 and Tom40 in cells as above, without immunoprecipitation. f, Immunoblot analysis (left) of Atad3a, Tom40, Tim23 and Pink1 in HEK293T cells treated for 1 h with OA or not (above lanes), assessed after immunoprecipitation as in e (above blots); numbers below, densitometry, relative to that of Pink1; bottom (Input), immunoblot analysis in cells as above, without immunoprecipitation. Right, quantification of immunoprecipitated Atad3a, Tom40, Tim23 (key) in cells as at left, presented as a ratio relative to that of Pink1. g, Immunoblot analysis of Tim23, MPPβ, Tom40 and Pink1 in HEK293T cells expressing control or Atad3a-specific shRNA (above lanes), assessed after immunoprecipitation as in e (above blots); numbers below, densitometry as in e; bottom (Input), immunoblot analysis of cells as above, without immunoprecipitation. h, Immunoblot analysis of an in vitro mitochondrial importation assay of Flag-tagged Pink1 in mitochondria isolated from cells expressing control or Atad3a-specific shRNA (above lanes); numbers below, densitometry analysis of cleaved Pink1, relative to that of full-length (FL) Pink1. i, Immunoblot analysis of endogenous Pink1, Tom40 and Tim23 in cells transfected with empty vector (EV) or to express Flag-tagged wild-type (WT) or mutant Atad3a (above lanes), assessed after immunoprecipitation with antibody to Flag (above blots); numbers below, densitometry relative to that of Flag; bottom (Input), immunoblot analysis of cells as above, without immunoprecipitation. j, Immunoblot analysis of Tim23, Tom40 and Pink1 in cells transfected as in i (above lanes) and expressing control (−) or Atad3a-specific (+) shRNA (above blots), assessed after immunoprecipitation as in e (above blots); numbers below, densitometry as in e; bottom (Input), immunoblot analysis of cells as above, without immunoprecipitation. k, Immunoblot analysis of an in vitro mitochondrial importation assay of Pink1 in mitochondria isolated from cells treated as in j; numbers below, as in h. Full-length original scans of blots, Supplementary Fig. 8. **P< 0.0l and ***P< 0.00l (one-way ANOVA followed by Bonferroni post-hoc test). Data are from one experiment representative of two independent experiments (b (right); mean±s.d. of n = 3 biological replicates) or are representative of three (a,c,d,g) or two (b (left),e,f,h) independent experiments.
Fig. 7
Fig. 7. Hyperactivation of mitophagy causes the aberrant stem cell and progenitor homeostasis in Atad3a deficient bone marrow
a, Immunoblot analysis of Atad3a in cells from Atad3afl/fl or Atad3afl/flMx1Cre mice treated with chloroquine or not (above lanes). b, Total bone marrow cells in mice as in a (key). c,d, Frequency (c) and number (d) of LT-HSCs, ST-HSCs, MPPs and LSK cells (horizontal axis) in the bone marrow of mice as in a (key). e, Flow cytometry of LT-HSCs, ST-HSCs, MPPs and LSK cells in the bone marrow of mice as in a (above plots). f,g, Frequency (f) and number (g) of CMPs, MEPs, GMPs and CLPs (horizontal axis) in the bone marrow of mice as in a (key). h, Flow cytometry of CMPs, MEPs and GMPs in the bone marrow of mice as in a (above plots). Numbers in or adjacent to outlined areas (e,h) indicate percent cells in each. *P<0.05, **P< 0.01 and ***P< 0.001 (one-way ANOVA followed by Bonferroni post-hoc test (b–d,f,g). Data are representative of two independent experiments (a) or are from two independent experiments (b–d,f,g (average); mean±s.d. of n = 8 mice per group).
Fig. 8
Fig. 8. Pink1-dependent mitophagy causes the aberrant stem-cell and progenitor homeostasis in Atad3a deficient bone marrow
a, Survival (Kaplan-Meier analysis) of Atad3afl/fl, Atad3afl/flMx1Cre and Atad3afl/flMx1CrePink1−/− mice (key) (n = 7 mice per group) at various times (horizontal axis) after injection of poly(I:C). b, Mitochondrial mass (as in Fig. 4a) of hematopoietic cell populations (horizontal axis) from Atad3afl/fl, Atad3afl/flMx1Cre, Atad3afl/flPink1−/− and Atad3afl/flMx1CrePink1−/− mice (key). c, Immunoblot analysis of various proteins (left margin) in the mitochondrial fractions of sorted Lin cells from mice as in b (above lanes). Full-length original scans of blots, Supplementary Fig. 8. d, Mitochondrial membrane potential (relative to mitochondrial mass, as in Fig. 4b) in hematopoietic cell populations (horizontal axis) from mice as in b (key). e, Oxygen-consumption rate (as in Fig. 4c) of sorted LSK cells from mice as in b (key). f, Total bone marrow cells in mice as in b (key). g,h, Frequency (g) and number (h) of LT-HSCs, ST-HSCs, MPPs and LSK cells (horizontal axis) in the bone marrow of mice as in b (key). i,j, Frequency (i) and number (j) of CMPs, MEPs, GMPs and CLPs (horizontal axis) in the bone marrow of mice as in b (key). *P<0.05, **P< 0.01 and ***P<0.001, Atad3afl/fl versus Atad3afl/flMx1Cre (black asterisks (a) or red asterisks (e)), Atad3afl/flMx1Cre versus Atad3afl/flMx1Cre+Pink1−/− (red asterisks (a)) or (black asterisks (e)) (log-rank (Mantel Cox) test (a), one-way ANOVA followed by Bonferroni post-hoc test (b,d–j)). Data are representative of two independent experiments (b,d,e; mean±s.d. of n = 3 mice per group), are from one experiment representative of three independent experiments (c) or are from two independent experiments (f,g–j (average); mean±s.d. of n = 5 mice per group).

Comment in

References

    1. Wallace DC, Fan W. Energetics, epigenetics, mitochondrial genetics. Mitochondrion. 2010;10:12–31. - PMC - PubMed
    1. Sun MG, et al. Correlated three-dimensional light and electron microscopy reveals transformation of mitochondria during apoptosis. Nat Cell Biol. 2007;9:1057–1065. - PubMed
    1. Salminen A, Kaarniranta K, Hiltunen M, Kauppinen A. Krebs cycle dysfunction shapes epigenetic landscape of chromatin: novel insights into mitochondrial regulation of aging process. Cell Signal. 2014;26:1598–1603. - PubMed
    1. Kim HR, et al. Mitochondrial DNA aberrations of bone marrow cells from patients with aplastic anemia. J Korean Med Sci. 2008;23:1062–1067. - PMC - PubMed
    1. Kim HR, et al. Mitochondrial DNA aberrations and pathophysiological implications in hematopoietic diseases, chronic inflammatory diseases, and cancers. Ann Lab Med. 2015;35:1–14. - PMC - PubMed

MeSH terms

Substances