. 2017 Dec 14;8(1):2132.
doi: 10.1038/s41467-017-02285-7.

Stochastic gene expression in Arabidopsis thaliana

Affiliations

Stochastic gene expression in Arabidopsis thaliana

Ilka Schultheiß Araújo et al. Nat Commun. .

Abstract

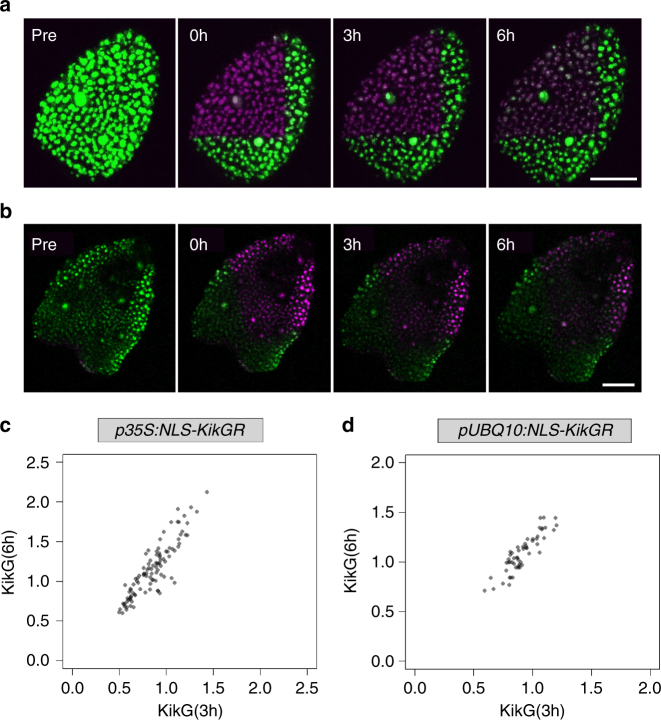
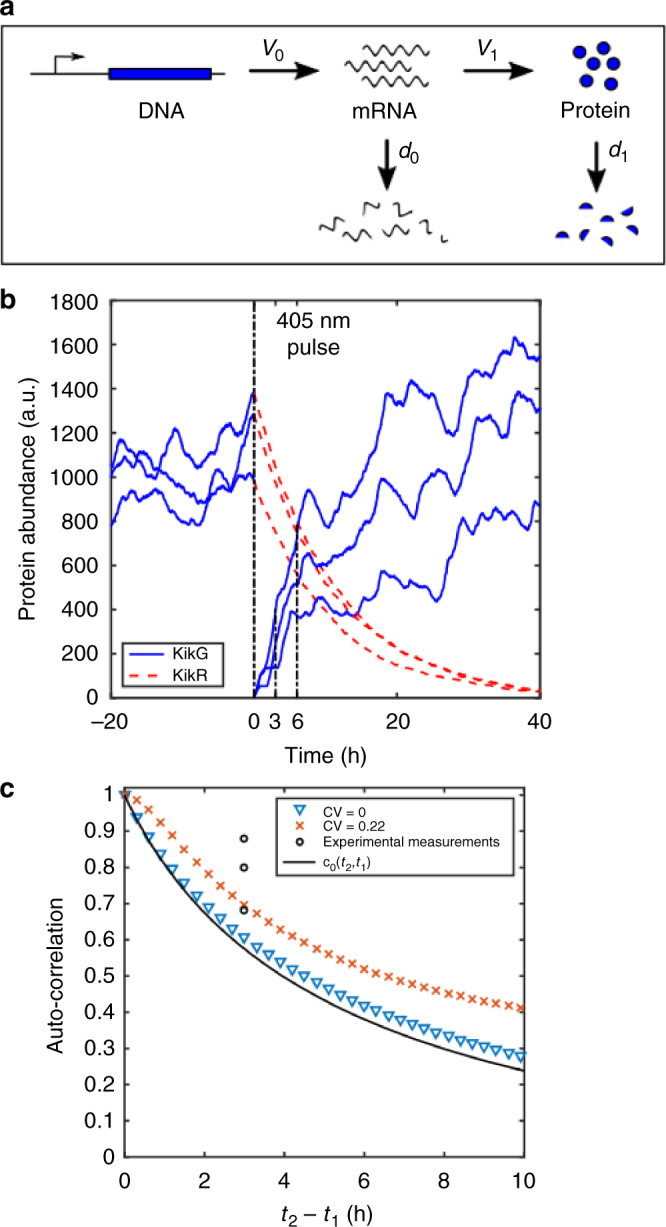
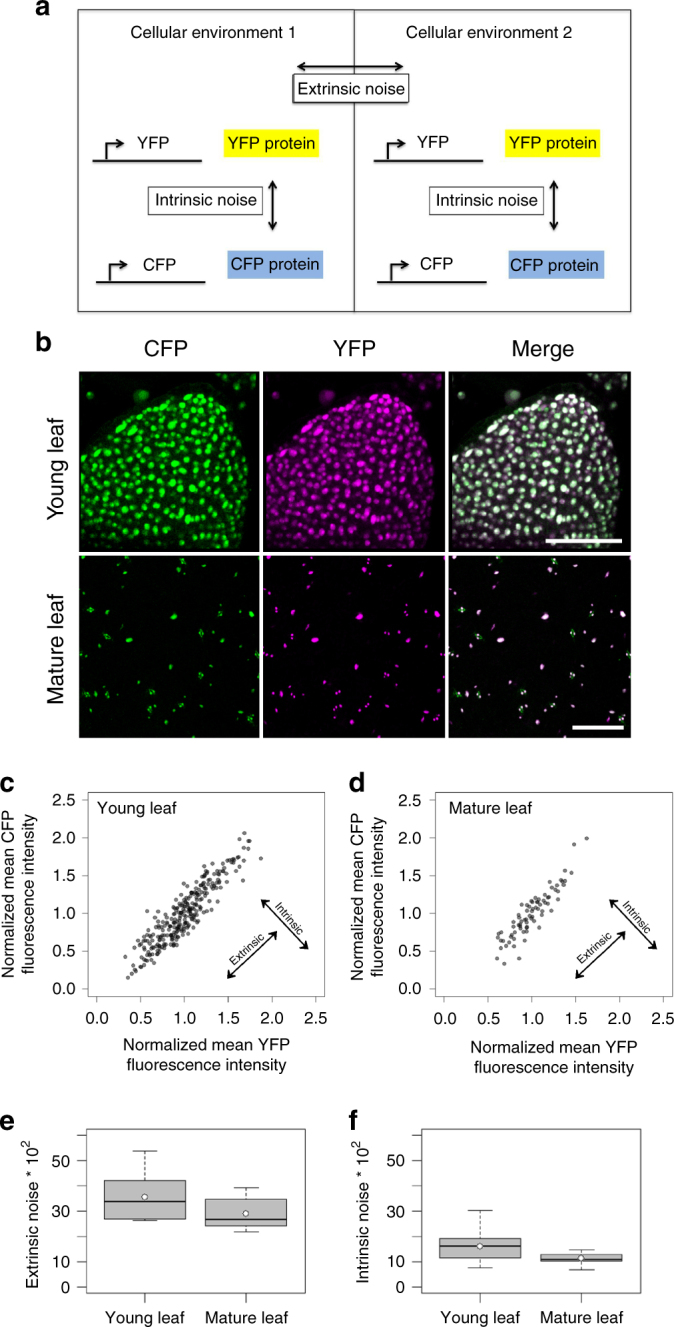
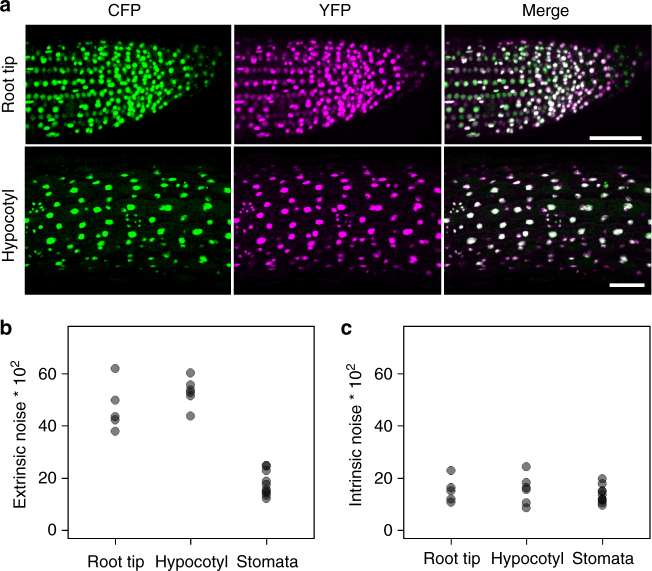
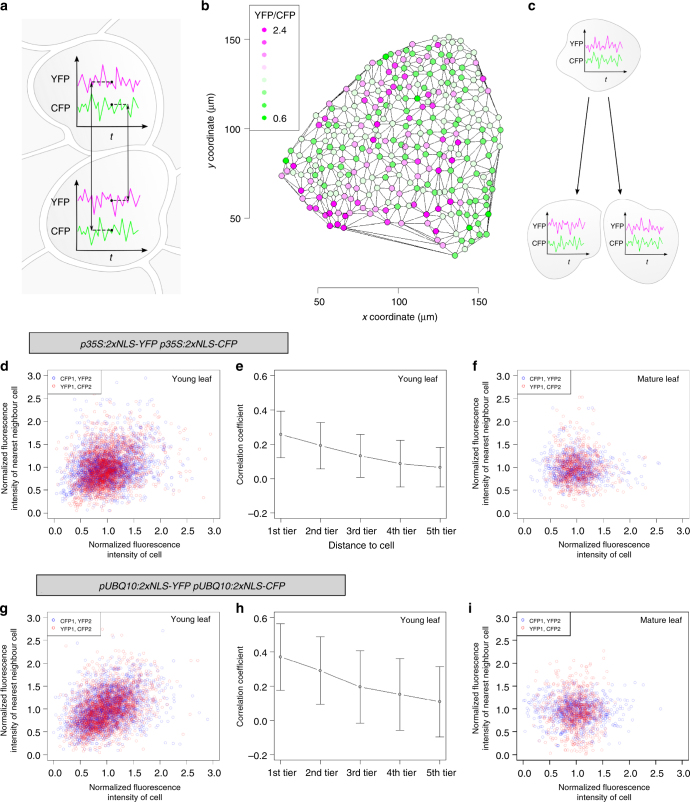
Although plant development is highly reproducible, some stochasticity exists. This developmental stochasticity may be caused by noisy gene expression. Here we analyze the fluctuation of protein expression in Arabidopsis thaliana. Using the photoconvertible KikGR marker, we show that the protein expressions of individual cells fluctuate over time. A dual reporter system was used to study extrinsic and intrinsic noise of marker gene expression. We report that extrinsic noise is higher than intrinsic noise and that extrinsic noise in stomata is clearly lower in comparison to several other tissues/cell types. Finally, we show that cells are coupled with respect to stochastic protein expression in young leaves, hypocotyls and roots but not in mature leaves. Our data indicate that stochasticity of gene expression can vary between tissues/cell types and that it can be coupled in a non-cell-autonomous manner.


Conflict of interest statement

The authors declare no competing financial interests.

Figures

Fig. 1
Fig. 1
Temporal analysis of fluctuation in p35S:NLS-KikGR and pUBQ10:NLS-KikGR lines. a Confocal laser scanning microscopy (CLSM) images of p35S:NLS-KikGR before (pre) and after conversion (0 h, 3 h and 6 h). b CLSM images of pUBQ10:NLS-KikGR before (pre) and after conversion (0 h, 3 h and 6 h). Scale bar: 50 µm. c Scatter plot of p35S:NLS-KikG expressing cells (n = 103) obtained from one representative leaf. The normalized mean fluorescence intensity of the cells at 3 h is plotted against the normalized mean fluorescence intensity of the cells at 6 h. Data points are shown in grey, overlapping data points appear black. d Scatter plot of pUBQ10:NLS-KikG expressing cells (n = 55) obtained from one representative leaf
Fig. 2
Fig. 2
Theoretical analysis of fluctuations. a Schematic illustration of the two-stage stochastic gene expression model. v = production rate, d = degradation rate. (b) Modelling of three stochastic realizations of the KikGR reporter. After a 405 nm pulse the green fluorescence-emitting KikG is transformed into red fluorescence-emitting KikR. The auto-correlation between KikG at 3 h and 6 h is calculated. Parameters are: ν0 = 2.25 h−1, d0 = 1.125 h−1, d 1 = 0.09 h−1 and ν 1 = 41.825 h−1, ν 1 = 48.506 h−1, ν 1 = 46.069 h−1 for the three different trajectories. (c) Modelling of the non-stationary auto-correlation of the two-stage gene expression model in presence of extrinsic noise (crosses and triangles) as calculated from stochastic simulation of the KikGR reporter from 105 trajectories (Supplementary Note 1) and the theoretical non-stationary auto-correlation of a birth-death process c0(t 2, t 1) (black solid line) as a lower bound of the non-stationary auto-correlation (Supplementary Note 1). The extrinsic noise is simulated as cell-to-cell variations in the protein translation rate ν 1 with different coefficients of variation (CV). Parameters for the two-stage model are: ν 0 = 2.25 h−1, d 0 = 1.125 h−1, d 1 = 0.09 h−1 and <ν 1 > = 45 h−1. In the case of no extrinsic noise (Var(ν 1) = 0 h−2, blue  triangles), the auto-correlation of the two-stage model approaches that of the birth-death model. With increasing extrinsic noise (Var(ν 1) = 100 h−2, red crosses) the auto-correlation increases. The reason for this is that the covariance and the variance become dominated by the extrinsic noise, for which a much longer correlation time was assumed
Fig. 3
Fig. 3
Intrinsic and extrinsic noise in young and mature rosette leaves of p35S:2xNLS-YFP p35S:2xNLS-CFP plants. a Schematic illustration of the experimental setup to determine the intrinsic and extrinsic noise. b CLSM images of a young, developing leaf and a mature leaf of a p35S:2xNLS-YFP p35S:2xNLS-CFP line. CFP is shown in green, YFP in magenta and the same fluorescence levels of both is indicated in white. Note, stomata show autofluorescence in the CFP channel. Scale bars: 50 µm (young leaf) and 100 µm (mature leaf). c Scatter plot of the normalized CFP mean fluorescence intensity plotted against the normalized YFP mean fluorescence intensity of single cells in one representative young leaf (n = 284). Pearson’s correlation coefficient = 0.914, Spearman's correlations coefficient = 0.905. Data points are shown in grey, overlapping data points appear black. d Scatter plot of the normalized CFP mean fluorescence intensity plotted against the normalized YFP mean fluorescence intensity of single cells in one representative mature leaf (n = 76). Pearson's correlation coefficient = 0.909, Spearman's correlation coefficient = 0.906. e Box plot of extrinsic noise measurements of young (n = 10 leaves with a total number of 2219 cells, median = 33.5) and mature leaves (n = 10 leaves with a total number of 757 cells, median = 26.6). The extrinsic noise was slightly but not significantly higher in young leaves as compared to mature leaves (p = 0.075 Wilcoxon rank-sum test). f Box plot of intrinsic noise measurements of young (n = 10 leaves with a total number of 2219 cells, median = 16.1) and mature leaves (n = 10 leaves with a total number of 757 cells, median = 10.8). The intrinsic noise was significantly higher in young leaves (p = 0.029 Wilcoxon rank-sum test). Boxes show 25th and 75th percentiles and median. White dots show mean values
Fig. 4
Fig. 4
Intrinsic and extrinsic noise in stomata cells, root tip cells and hypocotyl cells of p35S:2xNLS-YFP p35S:2xNLS-CFP plants. a CLSM images of a root tip and a hypocotyl of p35S:2xNLS-YFP p35S:2xNLS-CFP plants. CFP is green, YFP is magenta and overlay is white. b Plot of extrinsic noise of root tip cells (n = 6 roots with a total number of 463 cells, median = 43.4), hypocotyl cells (n = 6 hypocotyls with a total number of 690 cells, median = 53.1) and stomata cells (n = 10 from mature leaves with a total number of 513 cells, median = 16.6). c Plot of intrinsic noise of root tip cells (n = 6 roots with a total number of 463 cells, median = 15.1), hypocotyl cells (n = 6 hypocotyls with a total number of 690 cells, median = 15.9) and stomata cells (n = 10 from mature leaves with a total number of 513 cells, median = 12.8). The extrinsic noise in root tip cells and hypocotyl cells was significantly higher than in stomata cells (p = 0.00067 and p = 0.00025, Wilcoxon rank-sum test)
Fig. 5
Fig. 5
Nearest neighbour analysis of p35S:2xNLS-YFP p35S:2xNLS-CFP and pUBQ10:2xNLS-YFP pUBQ10:2xNLS-CFP plants. a Schematic illustration of the experimental setup to determine the cofluctuation of neighbouring cells. b Leaf area depicting the cell-to-cell variability of noise based on the YFP/CFP ratios in each cell. Colours show the YFP/CFP ratios as indicated in the legend. c Schematic illustration of the effect of cell division on cofluctuation. d Scatter plot of p35S:2xNLS-YFP p35S:2xNLS-CFP young leaves showing the normalized fluorescence intensities of cells plotted against the normalized fluorescence intensity of the nearest neighbour of the considered cells (neighbour cell with the lowest distance). Blue circles indicate the CFP fluorescence intensity of a cell (CFP1) plotted against the YFP fluorescence intensity of the nearest neighbouring cell (YFP2). Red circles show the YFP fluorescence intensity of a cell (YFP1) plotted against the CFP fluorescence intensity of the nearest neighbouring cell (CFP2) (n = 2219 cells; r = 0.341; p = 0.0002, randomization test). e Mutual dependency of the distance to the neighbouring cell and the cofluctuation in young rosette leaves of p35S:2xNLS-YFP p35S:2xNLS-CFP. Neighbouring cells were grouped into five tiers according to their distance (cell diameters) to the considered cell. Mean values and standard deviations are shown (n = 86,541 neighbourhood analyses (2219 cells×39 cells)). (f) Scatter plot of p35S:2xNLS-YFP p35S:2xNLS-CFP mature rosette leaves showing the normalized fluorescence intensities of cells plotted against the normalized fluorescence intensity of the nearest neighbour (n = 757 cells; r = 0.02; p = 0.433, randomization test). g Scatter plot of pUBQ10:2xNLS-YFP pUBQ10:2xNLS-CFP young rosette leaves showing the normalized fluorescence intensities of cells plotted against the normalized fluorescence intensity of the nearest neighbour (n = 2021 cells; r = 0.413; p = 0.0003, randomization test). h Mutual dependency of the distance to the neighbouring cell and the cofluctuation in young rosette leaves of pUBQ10:2xNLS-YFP pUBQ10:2xNLS-CFP. Neighbouring cells were grouped into five tiers according to their distance (cell diameters) to the considered cell. Mean values and standard deviations are shown (n = 78,819 neighbourhood analyses (2021 cells×39 neighbouring cells)). (i) Scatter plot of pUBQ10:2xNLS-YFP pUBQ10:2xNLS-CFP mature rosette leaves showing the normalized fluorescence intensities of cells plotted against the normalized fluorescence intensity of the nearest neighbour (n = 775 cells; r = −0.06; p = 0.681, randomization test)

References

    1. Meyer HM, Roeder AH. Stochasticity in plant cellular growth and patterning. Front. Plant Sci. 2014;5:420. - PMC - PubMed
    1. Raj A, van Oudenaarden A. Nature, nurture, or chance: stochastic gene expression and its consequences. Cell. 2008;135:216–226. doi: 10.1016/j.cell.2008.09.050. - DOI - PMC - PubMed
    1. Hong L, et al. Variable Cell Growth Yields Reproducible OrganDevelopment through Spatiotemporal Averaging. Dev. Cell. 2016;38:15–32. doi: 10.1016/j.devcel.2016.06.016. - DOI - PubMed
    1. Elsner J, Michalski M, Kwiatkowska D. Spatiotemporal variation of leaf epidermal cell growth: a quantitative analysis of Arabidopsis thaliana wild-type and triple cyclinD3 mutant plants. Ann. Bot. 2012;109:897–910. doi: 10.1093/aob/mcs005. - DOI - PMC - PubMed
    1. Roeder, A. H. K. et al. Variability in the Control of Cell Division Underlies Sepal Epidermal Patterning in Arabidopsis thaliana. PLoS Biol.8, e1000367 (2010). - PMC - PubMed

Publication types

Substances

LinkOut - more resources