. 2017 Dec 14;7(1):17605.
doi: 10.1038/s41598-017-18001-w.

Quantitative assessment of cell fate decision between autophagy and apoptosis

Affiliations

Quantitative assessment of cell fate decision between autophagy and apoptosis

Bing Liu et al. Sci Rep. .

Abstract

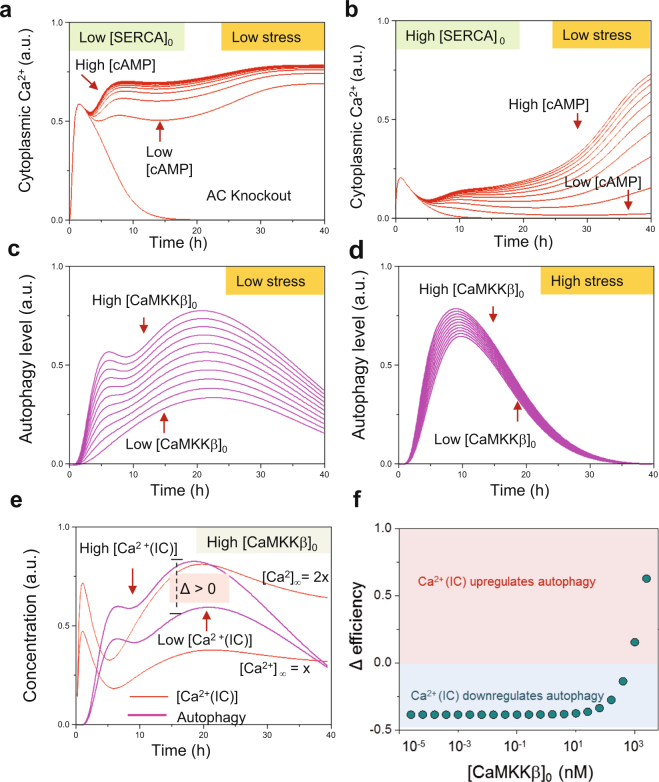
Autophagy and apoptosis are cellular processes that regulate cell survival and death, the former by eliminating dysfunctional components in the cell, the latter by programmed cell death. Stress signals can induce either process, and it is unclear how cells 'assess' cellular damage and make a 'life' or 'death' decision upon activating autophagy or apoptosis. A computational model of coupled apoptosis and autophagy is built here to analyze the underlying signaling and regulatory network dynamics. The model explains the experimentally observed differential deployment of autophagy and apoptosis in response to various stress signals. Autophagic response dominates at low-to-moderate stress; whereas the response shifts from autophagy (graded activation) to apoptosis (switch-like activation) with increasing stress intensity. The model reveals that cytoplasmic Ca2+ acts as a rheostat that fine-tunes autophagic and apoptotic responses. A G-protein signaling-mediated feedback loop maintains cytoplasmic Ca2+ level, which in turn governs autophagic response through an AMP-activated protein kinase (AMPK)-mediated feedforward loop. Ca2+/calmodulin-dependent kinase kinase β (CaMKKβ) emerges as a determinant of the competing roles of cytoplasmic Ca2+ in autophagy regulation. The study demonstrates that the proposed model can be advantageously used for interrogating cell regulation events and developing pharmacological strategies for modulating cell decisions.


Conflict of interest statement

The authors declare that they have no competing interests.

Figures

Figure 1
Figure 1
Reaction network model for autophagy-apoptosis crosstalk. (a) Schematic illustration of the main components and their key interactions. Activating and inhibitory interactions are distinguished by different types of arrows. Full names of compounds are given in Supplementary Table S1. (b) A more detailed diagram depicting the network of protein-protein and protein-ion/metabolite interactions. The network is composed of five coupled modules (calcium, inositol, mTOR, apoptosis and autophagy), shown in different background colors. Solid and dashed arrows refer to physical (association/disassociation/translocation) and chemical reactions, respectively. The complete list of reactions and interactions is presented in the Supplementary Table S2. Some components involved in multiple modules (e.g. AMPK, IP3R, Bcl-2, Bax, Atg5) are shown at multiple places, for clarity. Selected compounds/reactions identified as critical mediators of cell response are highlighted in red/blue ellipses.
Figure 2
Figure 2
Comparison of model predictions with experimental training data. Experimental and simulated time evolution of autophagic and apoptotic response of H4 cells to Torin-1 (a), staurosporine (STS) treatment (b), and tunicamycin treatment (c,d) are shown. Dashed curves represent the results from simulations; the symbols designate the experimental data points extracted from Xu et al..
Figure 3
Figure 3
Validation of the integrated model upon comparison of predictions with independent data generated in different cell lines. (a) Experimental and simulated time evolution of autophagic and apoptotic responses of a single H4 cell to STS treatment. (b) Experimentally observed probability densities and model-predicted histograms of autophagy and apoptosis levels in a population of H4 cells in response to 0, 10 and 24 h of starvation. (c) Experimental and simulated time evolution of autophagic and apoptotic responses of RPTC cells to cisplatin treatment. The dashed curves are obtained by computations; symbols designate the experimental data points. (d) Experimental and simulated abundance of LC3-II, cleaved caspase 3, DRAM, PUMA, Bax, phosphorylated AMPK, and the active form of mTOR in PC-12 cells in response to 12 and 24 h colistin treatment. The experimental data in panels a,b,c and d, refer to the results from Xu et al., Periyasamy-Thandavan et al., and Zhang et al., respectively.
Figure 4
Figure 4
Sensitivity analysis. Peaks display the reactions/interactions distinguished by their strong effect on autophagy (a) and apoptosis (b), grouped by the corresponding major component (labeled). Parameter index (abscissa) refers to Supplementary Table S2. (c) The core regulatory network composed of key determinants of cell decision.
Figure 5
Figure 5
Role of [Ca2+(IC)] in the onset of autophagy vs apoptosis as a function of stress intensity. (a) Time evolution of [Ca2+(IC)] as [SERCA] varies from to 1 to 100 nM for low dose (0.5 μM) of STS and high dose (2 μM) of STS. (b,c) Accompanying time evolutions of autophagy (b) and apoptosis (c).
Figure 6
Figure 6
Significance of cAMP and CaMKKβ in modulating the response of the cell to varying IC Ca2+ levels. The in silico cellular stress is induced by administering a low dose (0.5 µM) of STS, except for panel f where [STS] = 2 µM. (a,b) Time evolution of [Ca2+(IC)] under different initial concentrations of AC, for low (a) and high (b) [SERCA]. [cAMP] produced by AC varies from 10 (low) to 100 nM (high). (c,d) Simulated development of autophagy for 0.01 < [CaMKKβ]0 < 1 nM, under low (c) and high (d) stress. The propensity of the cell for autophagy increases with increase in [CaMKKβ]0. (e) Simulated profiles of autophagy (magenta) accompanying the changes in [Ca2+(IC)] (red) in the presence of elevated [CaMKKβ]0. The enhancement in autophagy level due to change in [Ca2+(IC)] by a factor of 2, is designated by Δ, which is the maximum difference between the two curves. (f) Dose-response curve of Δ as a function of [CaMKKβ]0. IC Ca2+ downregulates autophagy in general (see Fig. 5) despite the opposing effect of CaMKKβ, except for elevated (>103 nM) [CaMKKβ].
Figure 7
Figure 7
Cell response to different treatments predicted in silico under different stress conditions. The simulated autophagy and apoptosis level in response to low, medium, and high dose of STS stress, when the cells are subjected to the drugs listed along the left abscissa. The color-coded entries represent the fold change in autophagic (odd columns) and apoptotic (even columns) responses, relative to those in the absence of treatment.

References

    1. Kroemer G, Marino G, Levine B. Autophagy and the integrated stress response. Mol Cell. 2010;40:280–293. doi: 10.1016/j.molcel.2010.09.023. - DOI - PMC - PubMed
    1. He C, Klionsky DJ. Regulation mechanisms and signaling pathways of autophagy. Annu Rev Genet. 2009;43:67–93. doi: 10.1146/annurev-genet-102808-114910. - DOI - PMC - PubMed
    1. Boya P, Reggiori F, Codogno P. Emerging regulation and functions of autophagy. Nat Cell Biol. 2013;15:713–720. doi: 10.1038/ncb2788. - DOI - PMC - PubMed
    1. Hidvegi T, et al. An autophagy-enhancing drug promotes degradation of mutant alpha1-antitrypsin Z and reduces hepatic fibrosis. Science. 2010;329:229–232. doi: 10.1126/science.1190354. - DOI - PubMed
    1. Czaja MJ, et al. Functions of autophagy in normal and diseased liver. Autophagy. 2013;9:1131–1158. doi: 10.4161/auto.25063. - DOI - PMC - PubMed

Publication types

Substances

LinkOut - more resources