Comparative Study
. 2018 Sep;104(3):564-574.
doi: 10.1002/cpt.983. Epub 2018 Jan 17.

Gaining Mechanistic Insight Into Coproporphyrin I as Endogenous Biomarker for OATP1B-Mediated Drug-Drug Interactions Using Population Pharmacokinetic Modeling and Simulation

Affiliations
Comparative Study

Gaining Mechanistic Insight Into Coproporphyrin I as Endogenous Biomarker for OATP1B-Mediated Drug-Drug Interactions Using Population Pharmacokinetic Modeling and Simulation

Shelby Barnett et al. Clin Pharmacol Ther. 2018 Sep.

Abstract

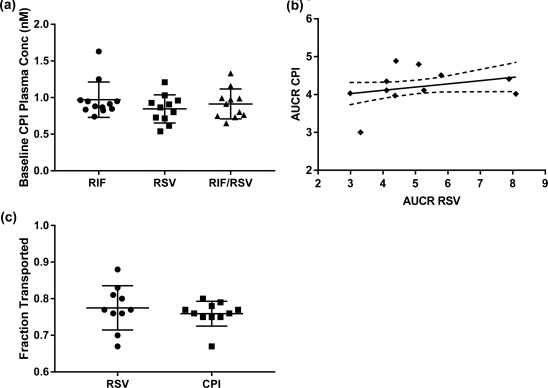
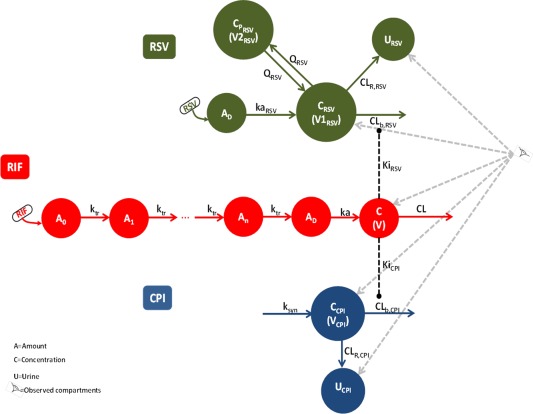
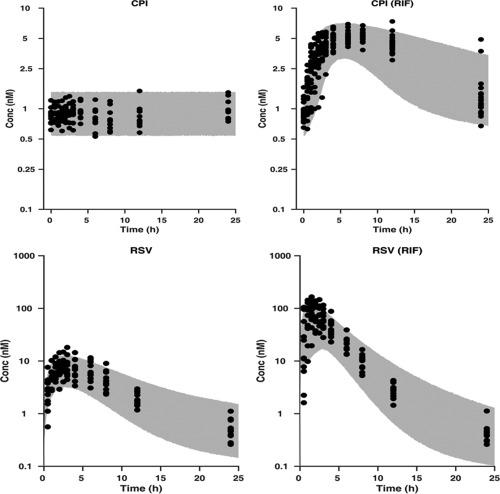
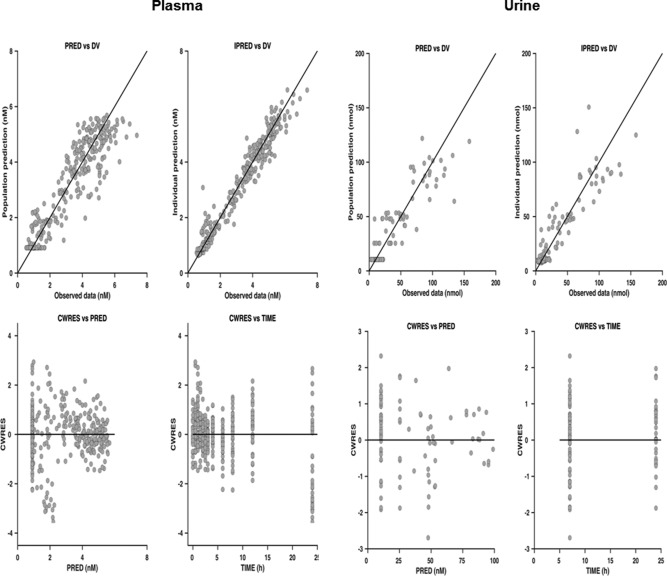
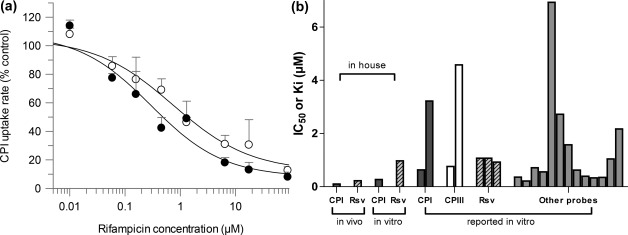
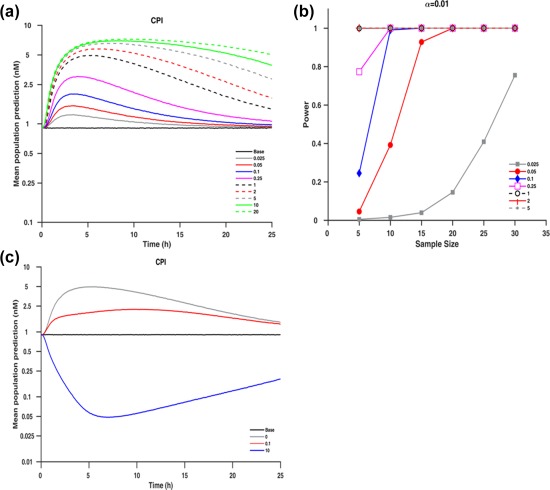
This study evaluated coproporphyrin I (CPI) as a selective endogenous biomarker of OATP1B-mediated drug-drug interactions (DDIs) relative to clinical probe rosuvastatin using nonlinear mixed-effect modeling. Plasma and urine CPI data in the presence/absence of rifampicin were modeled to describe CPI synthesis, elimination clearances, and obtain rifampicin in vivo OATP Ki. The biomarker showed stable interoccasion baseline concentrations and low interindividual variability (<25%) in subjects with wildtype SLCO1B1. Biliary excretion was the dominant CPI elimination route (maximal >85%). Estimated rifampicin in vivo unbound OATP Ki (0.13 μM) using CPI data was 2-fold lower relative to rosuvastatin. Model-based simulations and power calculations confirmed sensitivity of CPI to identify moderate and weak OATP1B inhibitors in an adequately powered clinical study. Current analysis provides the most detailed evaluation of CPI as an endogenous OATP1B biomarker to support optimal DDI study design; further pharmacogenomic and DDI data with a panel of inhibitors are required.


Figures

Figure 1
Figure 1
(a) Baseline plasma concentrations of coproporphyrin I taken prior to administration of rosuvastatin and/or rifampicin on three separate occasions (OCC1‐3). (b) Correlation between CPI and rosuvastatin AUCR in the presence of rifampicin. Data obtained in the same individuals.6 The solid line represents the line of linear regression and the dashed line represents the 95% confidence interval. (c) Individual calculated fT for rosuvastatin and CPI using rifampicin interaction data (Equation 1).
Figure 2
Figure 2
Schematic representation of the population PK models for rifampicin, coproporphyrin I (CPI), and rosuvastatin (RSV) and corresponding interactions of two probes with rifampicin (RIF).
Figure 3
Figure 3
Upper panel: Visual predictive check of the developed population PK model for CPI plasma data, superimposed with the observed data. CPI and CPI (RIF) represent control and rifampicin phase of the study, respectively. Lower panel: Visual predictive check of the developed population PK model for RSV plasma data, superimposed with the observed data. RSV and RSV (RIF) represent control and rifampicin phase of the study, respectively. The gray area represents the 95% prediction of the simulated data and the dark circles are the observed data.
Figure 4
Figure 4
Goodness‐of‐fit plots for population PK model describing CPI plasma and urine data. DV, PRED, IPRED, and CWRES are the observed data, population and individual model prediction, and conditional weighted residuals, respectively.
Figure 5
Figure 5
(a) Concentration‐dependent inhibition of CPI OATP‐mediated uptake in human hepatocytes using rifampicin, following preincubation with a buffer (○) or inhibitor (●) for 60 min. (b) Comparison of rifampicin model‐based in vivo Ki estimates with in vitro IC50/Ki estimates obtained in human hepatocytes (current study) or reported in OATP1B1 transfected cell line using different probes. Details of literature reported in vitro studies listed in Table S5.
Figure 6
Figure 6
(a) Median simulated plasma concentration of CPI at different I/Ki ratios relative to rifampicin. (b) Power curves at significance levels (α = 0.01) for the different hypothetical I/Ki ratios based on a one‐sample paired t‐test of the ratio of logarithmic transformed AUC. (c) Median simulated plasma concentration of CPI assuming rifampicin inhibition of k syn using hypothetical ratios of 0, 0.1, and 10 relative to the effect of rifampicin on CL b,CPI where ratio of 0 corresponds to scenario of no inhibition of ksyn (transporter inhibition only).

References

    1. Giacomini, K.M. et al Membrane transporters in drug development. Nat. Rev. Drug Discov. 9, 215–236 (2010). - PMC - PubMed
    1. Zamek‐Gliszczynski, M.J. et al ITC recommendations on transporter kinetic parameter estimation and translational modeling of transport‐mediated PK and DDIs in humans. Clin. Pharmacol. Ther. 94, 64–79 (2013). - PMC - PubMed
    1. Galetin, A. , Zhao, P. & Huang, S.M. Physiologically based pharmacokinetic modeling of drug transporters to facilitate individualized dose prediction. J. Pharm. Sci. 106, 2204–2208 (2017). - PubMed
    1. Rodrigues, A.D. , Taskar, K.S. , Kusuhara, H. & Sugiyama, Y. Endogenous probes for drug transporters: balancing vision with reality. Clin. Pharmacol. Ther. (2017) [Epub ahead of print]. - PubMed
    1. Yoshida, K. , Maeda, K. & Sugiyama, Y. Transporter‐mediated drug‐drug interactions involving OATP substrates: predictions based on in vitro inhibition studies. Clin. Pharmacol. Ther. 91, 1053–1064 (2012). - PubMed

Publication types

MeSH terms

LinkOut - more resources