. 2018 Apr 18;9(4):838-848.
doi: 10.1021/acschemneuro.7b00297. Epub 2018 Jan 8.

Neurodegenerative Disease Proteinopathies Are Connected to Distinct Histone Post-translational Modification Landscapes

Affiliations

Neurodegenerative Disease Proteinopathies Are Connected to Distinct Histone Post-translational Modification Landscapes

Karen Chen et al. ACS Chem Neurosci. .

Abstract

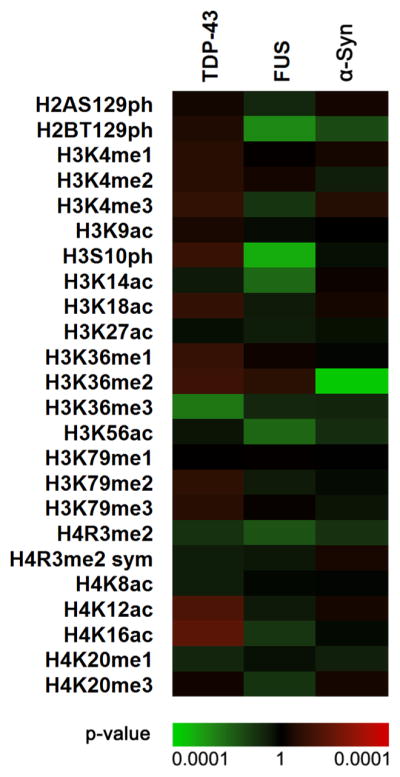
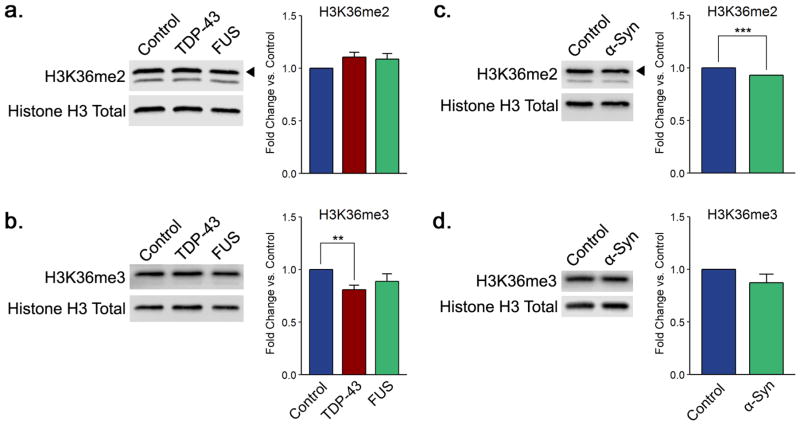
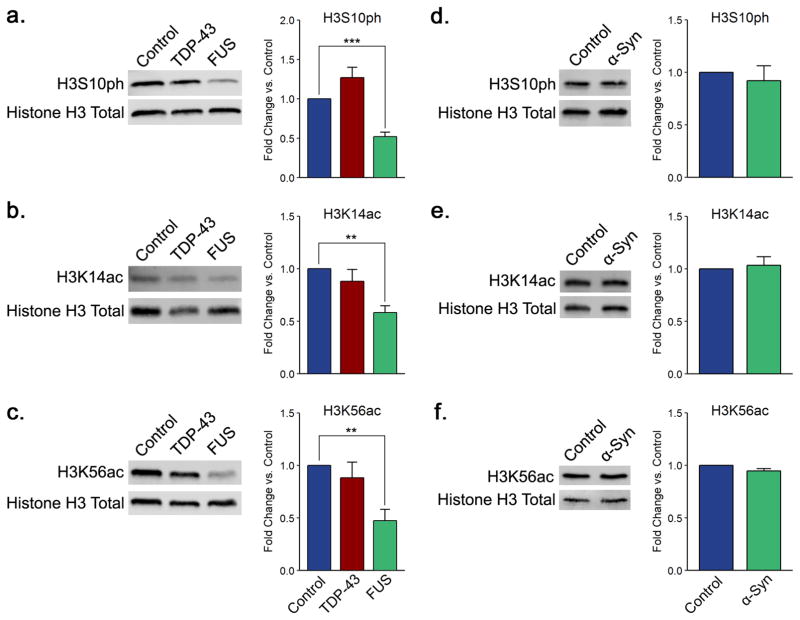
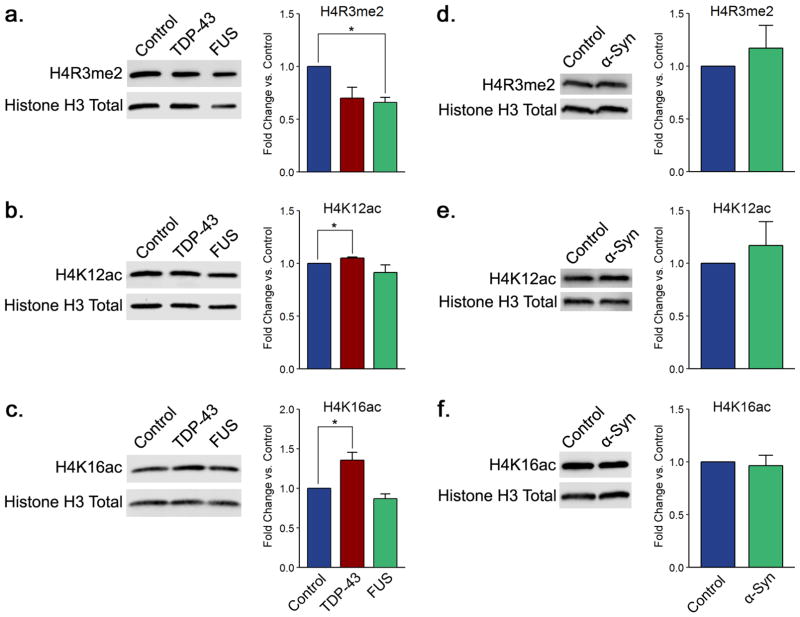
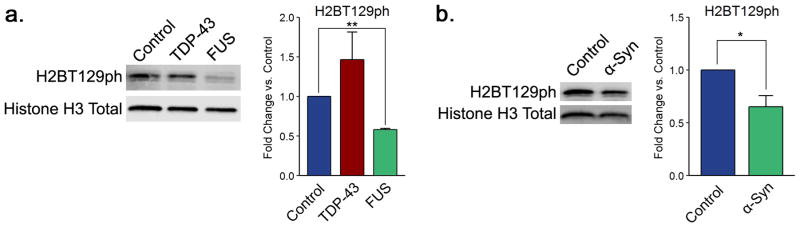
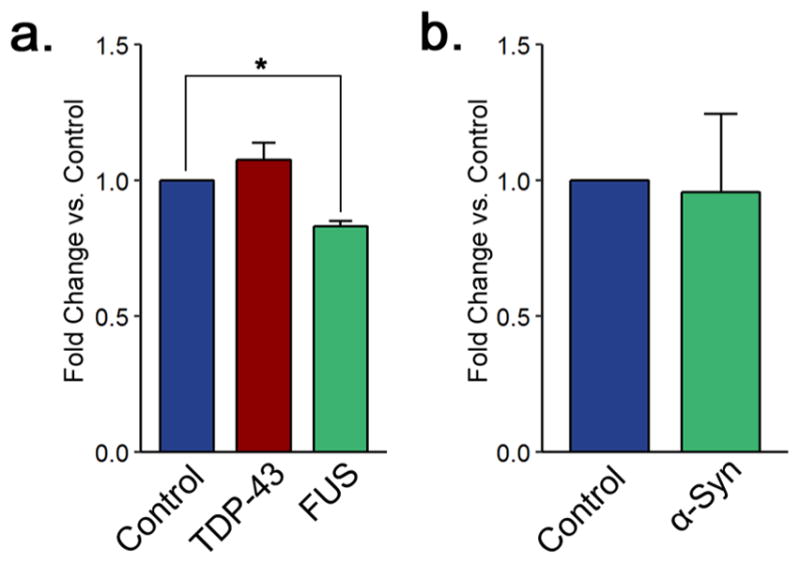
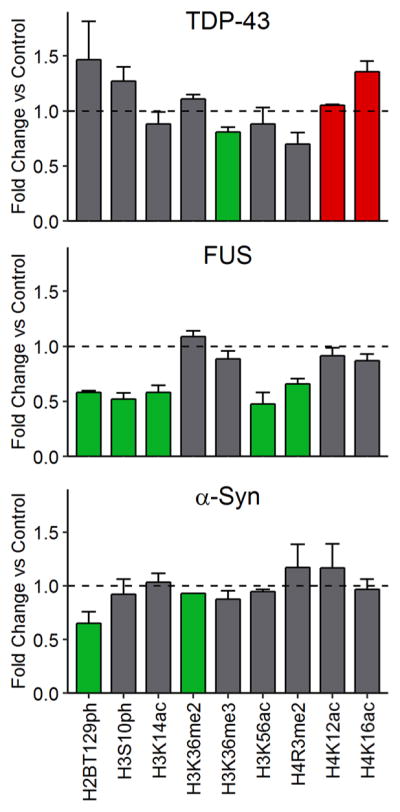
Amyotrophic lateral sclerosis (ALS) and Parkinson's disease (PD) are devastating neurodegenerative diseases involving the progressive degeneration of neurons. No cure is available for patients diagnosed with these diseases. A prominent feature of both ALS and PD is the accumulation of protein inclusions in the cytoplasm of degenerating neurons; however, the particular proteins constituting these inclusions vary: the RNA-binding proteins TDP-43 and FUS are most notable in ALS, while α-synuclein aggregates into Lewy bodies in PD. In both diseases, genetic causes fail to explain the occurrence of a large proportion of cases, and thus, both are considered mostly sporadic. Despite mounting evidence for a possible role of epigenetics in the occurrence and progression of ALS and PD, epigenetic mechanisms in the context of these diseases remain mostly unexplored. Here we comprehensively delineate histone post-translational modification (PTM) profiles in ALS and PD yeast proteinopathy models. Remarkably, we find distinct changes in histone modification profiles for each. We detect the most striking changes in the context of FUS aggregation: changes in several histone marks support a global decrease in gene transcription. We also detect more modest changes in histone modifications in cells overexpressing TDP-43 or α-synuclein. Our results highlight a great need for the inclusion of epigenetic mechanisms in the study of neurodegeneration. We hope our work will pave the way for the discovery of more effective therapies to treat patients suffering from ALS, PD, and other neurodegenerative diseases.

Keywords: ALS; FUS; Parkinson’s disease; TDP-43; epigenetics; histone modifications; α-synuclein.


Conflict of interest statement

Notes

The authors declare no competing financial interest.

Figures

Figure 1
Figure 1
Histone modifications are altered in the context of yeast overexpressing TDP-43, FUS, and α-synuclein (α-Syn). Shown are p values for the ratios of histone H2A, H2B, H3, and H4 PTM abundances in yeast strains expressing TDP-43, FUS, and α-Syn relative to control cells. The scale is based on p values derived from statistical analysis of Western blotting experiments. The p values were calculated using a two-tailed t test with Welch’s modification. Green indicates more statistically significant decreased modification levels, while red indicates more statistically significant increased modification levels.
Figure 2
Figure 2
α-Synuclein and TDP-43 proteinopathy models display decreases in histone H3 di- and trimethylation, respectively, on lysine 36. Shown are representative immunoblots displaying the levels of (a, c) H3K36me2 and (b, d) H3K36me3 for TDP-43 and FUS and for α-synuclein yeast proteinopathy models, respectively. Quantitation histograms compiling multiple biological replicates are presented alongside the blots. All of the graphs display the mean fold change in modification levels for each group based on densitometric analysis of Western blots. Error bars indicate the +SEM (n = 3–7) for each modification. **, p < 0.01; ***, p < 0.001.
Figure 3
Figure 3
FUS overexpression correlates with changes in phosphorylation on serine 10 and acetylation on lysine 14 and lysine 56 of histone H3. Shown are representative immunoblots displaying the levels of (a, d) H3S10ph, (b, e) H3K14ac, and (c, f) H3K56ac for TDP-43 and FUS and for α-synuclein yeast proteinopathy models, respectively. Quantitation histograms compiling multiple biological replicates are presented alongside the blots. All of the graphs display the mean fold change in modification levels for each group based on densitometric analysis of Western blots. Error bars indicate +SEM (n = 3–6) for each modification. **, p < 0.01; ***, p < 0.001.
Figure 4
Figure 4
FUS and TDP-43 overexpression correlate with changes in arginine dimethylation and lysine acetylation of histone H4. Shown are representative immunoblots displaying the levels of (a, d) H4R3me2, (b, e) H4K12ac, and (c, f) H4K16ac for TDP-43 and FUS and for α-synuclein yeast proteinopathy models, respectively. Quantitation histograms compiling multiple biological replicates are presented alongside the blots. All of the graphs display the mean fold change in modification levels for each group based on densitometric analysis of Western blots. Error bars indicate +SEM (n = 3–6) for each modification. *, p < 0.05.
Figure 5
Figure 5
FUS and α-synuclein proteinopathies are associated with changes in histone H2B phosphorylation levels. Shown are representative immunoblots displaying the levels of H2BT129ph for (a) TDP-43 and FUS and (b) α-synuclein yeast proteinopathy models. Quantitation histograms compiling multiple biological replicates are presented alongside the blots. All of the graphs display the mean fold change in modification levels for each group based on densitometric analysis of Western blots. Error bars indicate +SEM (n ≥ 3) for each modification. *, p < 0.05; **, p < 0.01.
Figure 6
Figure 6
RNA levels are decreased in a FUS overexpression ALS model. (a) Total RNA levels in yeast control cells and cells overexpressing TDP-43 and FUS. (b) Total RNA levels in yeast control cells and cells overexpressing α-synuclein. All of the graphs display the mean fold change in total RNA levels for each group. Error bars indicate +SEM (n = 3) for each group. *, p < 0.05.
Figure 7
Figure 7
Yeast models of neurodegenerative disease proteinopathies are connected to distinct histone post-translational modification landscapes. Green bars indicate significant decreases and red bars significant increases relative to control samples. Error bars indicate +SEM (n ≥ 3) for each modification.

References

    1. Beitz JM. Parkinson’s disease: a review. Front Biosci, Scholar Ed. 2014;S6:65–74. - PubMed
    1. Kim HJ, Kim NC, Wang YD, Scarborough EA, Moore J, Diaz Z, MacLea KS, Freibaum B, Li S, Molliex A, Kanagaraj AP, Carter R, Boylan KB, Wojtas AM, Rademakers R, Pinkus JL, Greenberg SA, Trojanowski JQ, Traynor BJ, Smith BN, Topp S, Gkazi AS, Miller J, Shaw CE, Kottlors M, Kirschner J, Pestronk A, Li YR, Ford AF, Gitler AD, Benatar M, King OD, Kimonis VE, Ross ED, Weihl CC, Shorter J, Taylor JP. Mutations in prion-like domains in hnRNPA2B1 and hnRNPA1 cause multisystem proteinopathy and ALS. Nature. 2013;495:467–473. - PMC - PubMed
    1. Poewe W, Seppi K, Tanner CM, Halliday GM, Brundin P, Volkmann J, Schrag AE, Lang AE. Parkinson disease. Nature reviews Disease primers. 2017;3:17013. - PubMed
    1. Robberecht W, Philips T. The changing scene of amyotrophic lateral sclerosis. Nat Rev Neurosci. 2013;14:248–264. - PubMed
    1. Landgrave-Gomez J, Mercado-Gomez O, Guevara-Guzman R. Epigenetic mechanisms in neurological and neurodegenerative diseases. Front Cell Neurosci. 2015;9:58. - PMC - PubMed

Publication types

MeSH terms