. 2018 Feb 1;159(2):895-906.
doi: 10.1210/en.2017-03120.

β-Cell Control of Insulin Production During Starvation-Refeeding in Male Rats

Affiliations

β-Cell Control of Insulin Production During Starvation-Refeeding in Male Rats

Brandon B Boland et al. Endocrinology. .

Abstract

Mammalian metabolism has evolved to adapt to changes in nutrient status. Insulin, the key anabolic hormone, facilitates intracellular storage of nutrient fuels and plays a pivotal role in the transition away from catabolism upon refeeding. Although circulating insulin relative to nutrient levels has been well characterized during fasting and refeeding, how pancreatic β-cell biology caters to acute changes in insulin demand has not been sufficiently addressed. Here, we examined the dynamics of (pro)insulin production and associated changes in β-cell ultrastructure during refeeding after a 72-hour fast in male rats. We found that fasted β-cells had marked degranulation, which inversely coordinated with the upregulation of autophagolysomal and lysosomal organelles. There was also expanded Golgi that correlated with enhanced (pro)insulin biosynthetic capacity but, conversely, blunted in vivo insulin secretion. Within 4 to 6 hours of refeeding, proinsulin biosynthesis, cellular ultrastructure, in vivo insulin secretion, and glucose tolerance normalized to levels near those of fed control animals, indicating a rapid replenishment of normal insulin secretory capacity. Thus, during a prolonged fast, the β-cell protects against hypoglycemia by markedly reducing insulin secretory capacity in vivo but is simultaneously poised to efficiently increase (pro)insulin production upon refeeding to effectively return normal insulin secretory capacity within hours.


Figures

Figure 1.
Figure 1.
Circulating in vivo parameters of study animals. Analysis of (A) body weight, (B) plasma glucose, (C) plasma insulin, and (D) plasma proinsulin in 12-week-old rats undergoing a 72-hour fast followed by ad libitum refeeding. Statistical significance was determined by one-way ANOVA followed by a Fisher least significant difference post hoc test. Results are presented as the mean ± standard error (n ≥ 4). *P ≤ 0.05; **P ≤ 0.01; ***P ≤ 0.001; ****P ≤ 0.0001 compared with control rats fed ad libitum.
Figure 2.
Figure 2.
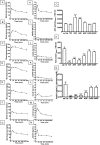
Insulin and glucose values during intraperitoneal GTT. Intraperitoneal injection of glucose (1 g/kg body weight) to rats and subsequent analysis of circulating glucose and insulin levels over a 3-hour period was determined. The glucose excursions of rats fed (A) ad libitum, (B) fasted for 72 hours, or refed for (C) 2, (D) 4, (E) 6, (F) 24, or (G) 60 hours after a 72-hour fast are displayed. The corresponding insulin excursions during this test are indicated for rats that were fed (H) ad libitum, (I) fasted for 72 hours, or refed for (J) 2, (K) 4, (L) 6, (M) 24, or (N) 60 hours after a 72-hour fast. The corresponding glucose excursions as gross areas under the curve (AUCgross) during the intraperitoneal GTT for (O) glucose and (P) insulin. (Q) Insulin (ng/mL) to glucose (mg/dL) ratio at time 0 of the intraperitoneal GTT. Statistical significance was determined by one-way ANOVA followed by a Fisher least significant difference post hoc test. Results are presented as the mean ± standard error (n ≥ 4). *P ≤ 0.05; **P ≤ 0.01; ***P ≤ 0.001; ****P ≤ 0.0001 compared with ad libitum fed controls. AUC, area under the curve.
Figure 3.
Figure 3.
Isolated islet protein and specific (pro)insulin biosynthesis, insulin secretion, and insulin transcript analysis. (A) Representative alkaline-urea PAGE autoradiograph images of immunoprecipitated [3H]proinsulin-1 and [3H]proinsulin-2 biosynthesis from freshly isolated islets treated with glucose (3 or 17 mM for 90 min) and pulse-radiolabeled with [3H]leucine. (B) Densitometric analysis of [3H]proinsulin alkaline-urea PAGE autoradiography of 17 mM glucose–treated islets normalized to 3 mM glucose-stimulated biosynthesis. (C) Total protein synthesis analysis by trichloroacetic acid precipitation of isolated islets from fasted-refed animals normalized to 3 mM glucose-stimulated biosynthesis. (D) Ratio of islet preproinsulin-1 and preproinsulin-2 mRNA levels (Ins1 and Ins2) to β-actin mRNA determined by quantitative reverse transcription polymerase chain reaction and normalized to the transcript levels of islets from ad libitum fed control rat islets using the 2ΔΔCt method. (E) One-hour total insulin secretion from freshly isolated islets normalized to total islet insulin content. Statistical significance was determined by one-way ANOVA followed by a Fisher least significant difference post hoc test. Results are presented as the mean ± standard error (n ≥ 3). *P ≤ 0.05; **P ≤ 0.01; ***P ≤ 0.001; ****P ≤ 0.0001 compared with ad libitum fed controls.
Figure 4.
Figure 4.
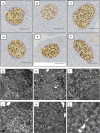
Representative immunohistochemical staining of fixed pancreata sections and electron micrographs of freshly isolated islet β-cells. Immunohistochemical staining of insulin (yellow), glucagon (purple), and MafA (brown) of fixed pancreata from rats that were (A) ad libitum fed, (B) 72-hour fasted, or 72-hour fasted and ad libitum refed for (C) 2, (D) 4, (E) 24, or (F) 60 hours. Representative transmission electron micrographs of high-pressure, fix-frozen pancreatic islet β-cells isolated from rats that were (G) ad libitum fed, (H) 72-hour fasted, or 72-hour fasted and ad libitum refed for (I) 2, (J) 4, (K) 24, or 60 (L) hours. Multimembraned organelles localized exclusively near the Golgi are annotated with yellow asterisks in (H). These structures were not observed in ad libitum fed or fasted-refed animals. Scale bars, (A–F) 1 mm and (G–L) 1 µm.
Figure 5.
Figure 5.
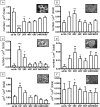
Quantification of conventional electron micrograph analysis of freshly isolated islet β-cells. Islets isolated from fasted-refed rats were high-pressure fix-frozen immediately after isolation. Then, micrographs of β-cells were collected, and the number of (A) mature granules, (B) immature granules, (C) autolysosomes, and (D) lysosomes or the area occupied by the (E) Golgi or (F) endoplasmic reticulum was quantified as described in Materials and Methods. Statistical significance was determined by Kruskal-Wallis test followed by Dunn post hoc test. The quantification results are presented mean ± standard error (n = 4 islet isolations; n ≥ 10 micrographs). *P ≤ 0.05; **P ≤ 0.01; ***P ≤ 0.001; ****P ≤ 0.0001 compared with ad libitum fed controls. Representative electron micrographs of quantified structures are included in the inset of each graph.
Figure 6.
Figure 6.
Representative examples of MMOs. (A–G) MMOs were exclusively observed near the cis-Golgi of β-cells from 72-hour fasted rats.

References

    1. Chakravarthy MV, Booth FW. Eating, exercise, and “thrifty” genotypes: connecting the dots toward an evolutionary understanding of modern chronic diseases. J Appl Physiol (1985). 2004;96(1):3–10. - PubMed
    1. Neel JV. Diabetes mellitus: a “thrifty” genotype rendered detrimental by “progress”? Am J Hum Genet. 1962;14(4):353–362. - PMC - PubMed
    1. Best CH, Haist RE, Ridout JH. Diet and the insulin content of pancreas. J Physiol. 1939;97(1):107–119. - PMC - PubMed
    1. Unger RH, Eisentraut AM, Madison LL. The effects of total starvation upon the levels of circulating glucagon and insulin in man. J Clin Invest. 1963;42(7):1031–1039. - PMC - PubMed
    1. Giddings SJ, Chirgwin J, Permutt MA. The effects of fasting and feeding on preproinsulin messenger RNA in rats. J Clin Invest. 1981;67(4):952–960. - PMC - PubMed

Publication types